
Synthetix drops 9.13% as sellers dominate short-term trade near $0.239

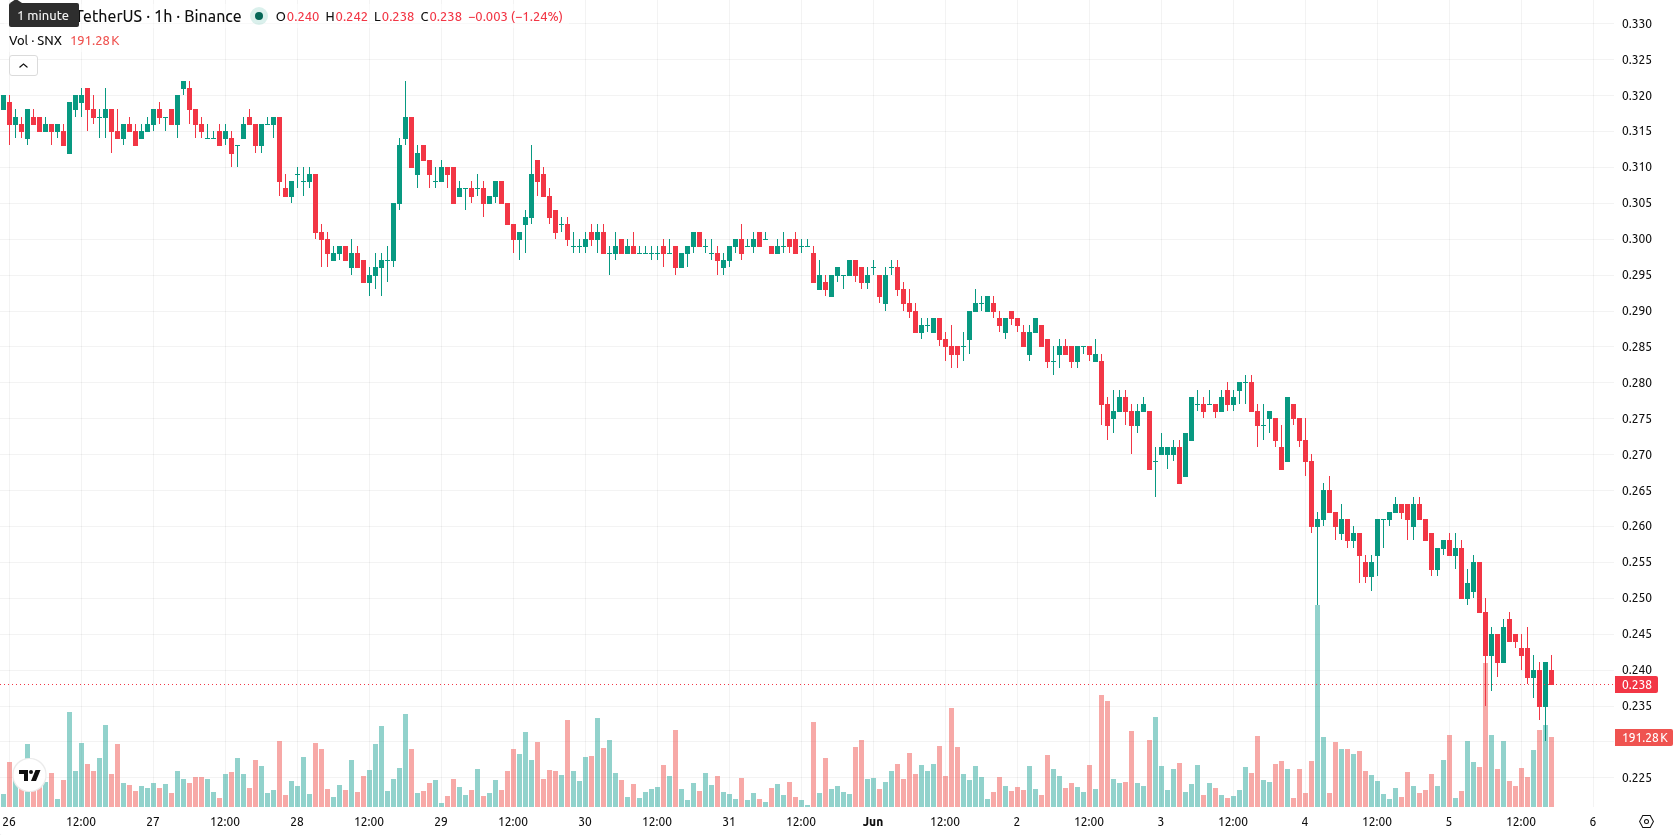
Synthetix (SNX) is trading at $0.2390, having declined 9.13% over the past 24 hours. The asset is currently positioned below its key short- and long-term moving averages, reflecting sustained negative momentum during today’s highly volatile session.
 0.238
0.2510
0.238
0.2510
Highlights
- Synthetix expanded its perpetual contract collateral options on Ethereum Mainnet by allowing ETH as the first non-USDT asset, enhancing trader flexibility and liquidity sources.
- The protocol's hybrid model, combining off-chain order matching and on-chain settlement with security from SNX stakers and SLP depositors, reinforces its market positioning despite ongoing selling pressure.
- SNX/USD remains under strong bearish momentum, trading below key moving averages with a 73% probability of further decline and an expected price range of $0.2230 to $0.2511 in the next 2–3 days.
Expanded trader options as ETH collateral broadens liquidity sources
The launch of multicollateral margin on Synthetix, with ETH now accepted as the first non-USDT asset for perpetual contract collateral on the Ethereum Mainnet, marked a key platform expansion. This move increases trader flexibility and broadens potential liquidity sources, as users can leverage major assets like ETH when engaging with perpetual products. Synthetix’s approach of combining off-chain order matching with on-chain settlement, supported by protocol-level security through SNX stakers and SLP depositors, continues to support the platform’s competitive positioning — though price action has remained under broader selling pressure.
Sustained downside momentum as technical barriers reinforce seller control
On the H1 timeframe, SNX/USD remains below the MA-20 at $0.2468 and MA-50 at $0.2572, with daily price action also under the MA-200 at $0.3751. The Ichimoku Kijun currently provides key resistance at $0.2485. Momentum indicators, including MACD and ADX, reflect ongoing downside strength. Additional signals from RSI at 31.55, Stoch RSI, and CCI suggest the asset is oversold, while BBP and the Awesome Oscillator further validate persistent seller dominance. SNX/USD is trading near intraday lows after a volatile session.
Directional bias for further weakness as reversal odds remain low
In the next 2–3 trading days, SNX/USD is expected to range between $0.2230 and $0.2511, which reflects the typical volatility band relative to current levels. The probability of an upward reversal stands at 27%, while continued decline is assessed at 73%. Should the price remain confined to the current support and resistance zone, sideways movement may persist. A decisive move above the resistance threshold would signal a bullish shift, while a break below support would likely trigger a further acceleration of short-term losses.
Earlier, analysts noted that Synthetix was experiencing persistent bearish momentum amid sustained selling pressure. The latest developments reinforce this trend, and with volatility remaining elevated, traders should closely monitor for a decisive move beyond the current resistance or support zones to signal the next directional shift.


Latest Synthetix News






-
 Afghanistan
-
 Albania
-
 Algeria
-
 Angola
-
 Argentina
-
 Armenia
-
 Australia
-
 Austria
-
 Azerbaijan
-
 Bahamas
-
 Bahrain
-
 Bangladesh
-
 Belarus
-
 Belgium
-
 Bolivia
-
 Botswana
-
 Brazil
-
 Brunei
-
 Bulgaria
-
 Cambodia
-
 Cameroon
-
 Canada
-
 Chile
Chile
-
 China
China
-
 Colombia
-
 Congo
Congo
-
 Costa Rica
-
 Cote d'Ivoire
-
 Croatia
-
 Cuba
Cuba
-
 Cyprus
-
 Czechia
-
 DR Congo
-
 Denmark
-
 Dominican Republic
-
 Ecuador
-
 Egypt
Egypt
-
 El Salvador
-
 Estonia
-
 Eswatini
-
 Ethiopia
-
 Finland
-
 France
-
 Georgia
-
 Germany
-
 Ghana
Ghana
-
 Greece
-
 Haiti
Haiti
-
 Hong Kong
-
 Hungary
-
 India
India
-
 Indonesia
-
 Iran, Islamic republic
-
 Iraq
Iraq
-
 Ireland
-
 Israel
-
 Italy
Italy
-
 Jamaica
-
 Japan
Japan
-
 Jordan
-
 Kazakhstan
-
 Kenya
Kenya
-
 Korea
Korea
-
 Kuwait
-
 Kyrgyzstan
-
 Laos
Laos
-
 Latvia
-
 Lebanon
-
 Lesotho
-
 Libya
Libya
-
 Lithuania
-
 Luxembourg
-
 Madagascar
-
 Malaysia
-
 Malta
Malta
-
 Mauritius
-
 Mexico
-
 Moldova
-
 Mongolia
-
 Montenegro
-
 Morocco
-
 Mozambique
-
 Myanmar
-
 Namibia
-
 Nepal
Nepal
-
 Netherlands
-
 New Zealand
-
 Nigeria
-
 North Macedonia
-
 Norway
-
 Oman
Oman
-
 Pakistan
-
 Palestine
-
 Panama
-
 Papua New Guinea
-
 Paraguay
-
 Peru
Peru
-
 Philippines
-
 Poland
-
 Portugal
-
 Puerto Rico
-
 Qatar
Qatar
-
 Reunion
-
 Romania
-
 Rwanda
-
 Saudi Arabia
-
 Serbia
-
 Singapore
-
 Slovakia
-
 Slovenia
-
 Somalia
-
 South Africa
-
 Spain
Spain
-
 Sri Lanka
-
 Sweden
-
 Switzerland
-
 Syria
Syria
-
 Taiwan
-
 Tajikistan
-
 Tanzania
-
 Thailand
-
 Trinidad and Tobago
-
 Tunisia
-
 Turkey
-
 UAE
UAE
-
 Uganda
-
 Ukraine
-
 United Kingdom
-
United States
-
 Uruguay
-
 Uzbekistan
-
 Venezuela
-
 Vietnam
-
 Yemen
Yemen
-
 Zambia
-
 Zimbabwe
- Forex
- Crypto











