

Tezos sinks 8.29% as sellers remain in control of short-term trend

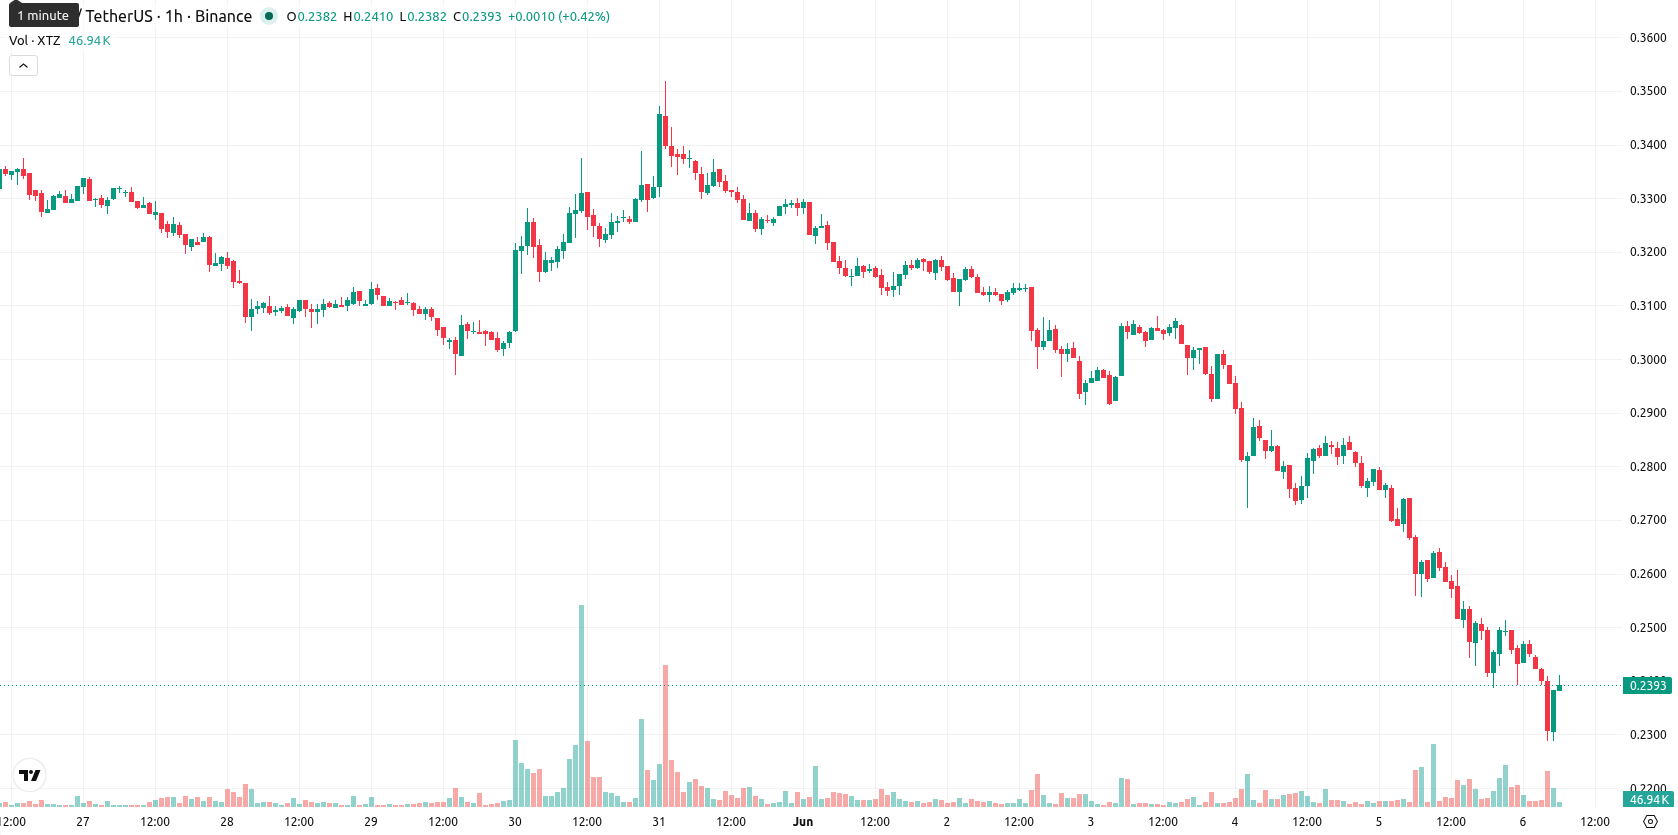
Tezos (XTZ) is trading at $0.2379, marking a daily decline of 8.29%. The asset sits below its key moving averages, highlighting persistent downward momentum over today's session.
 0.3521
0.33380000
0.3521
0.33380000
Highlights
- XTZ/USD shows persistent bearish momentum, trading below major moving averages with strong selling pressure dominating all time frames.
- Most indicators, including MACD, ADX, and AO, confirm continued downside, while oversold readings on RSI and CCI highlight a stressed technical backdrop.
- XTZ/USD is projected to consolidate in the $0.2126–$0.2632 zone, with a 79% probability of further declines versus only a 21% chance of upward movement.
Bearish technical signals as oversold readings counter rebound hints
XTZ/USD is trading below the MA-20 ($0.24738000), MA-50 ($0.26482600), and the long-term MA-200 ($0.42548400) on the hourly chart. The Ichimoku Kijun level at $0.25140000 serves as immediate resistance. Momentum signals remain negative: MACD and ADX are giving Sell signals, the Awesome Oscillator confirms downside movement, and RSI is at 32.54, flagging oversold conditions matched by the CCI. However, Stoch RSI suggests a potential for a short-term rebound with a Strong Buy reading. BBP further indicates sustained selling strength intraday, while high volatility and a negative gap of 0.0152 support the case for continued downside.
High downside risk as narrow probability favors further losses
In the short-term, XTZ/USD is expected to consolidate within the $0.21258771 to $0.26321229 range over the next two to three trading days. The probability of an upward move is only 21%, against a much higher 79% chance of continued declines. The most likely scenario involves trading within this volatility band, with a break above immediate resistance required for a bullish shift, and a move below the lower end of the range likely to prompt further downside.
Earlier, analysts noted that Tezos was exhibiting persistent bearish momentum, with technical indicators highlighting continued downside risks. Fresh signals from today’s session not only reinforce this negative outlook but also suggest that close attention should be paid to the risk of a decisive break below the current consolidation range, which could accelerate further declines.





Latest Tezos News






-
 Afghanistan
-
 Albania
-
 Algeria
-
 Angola
-
 Argentina
-
 Armenia
-
 Australia
-
 Austria
-
 Azerbaijan
-
 Bahamas
-
 Bahrain
-
 Bangladesh
-
 Belarus
-
 Belgium
-
 Bolivia
-
 Botswana
-
 Brazil
-
 Brunei
-
 Bulgaria
-
 Cambodia
-
 Cameroon
-
 Canada
-
 Chile
Chile
-
 China
China
-
 Colombia
-
 Congo
Congo
-
 Costa Rica
-
 Cote d'Ivoire
-
 Croatia
-
 Cuba
Cuba
-
 Cyprus
-
 Czechia
-
 DR Congo
-
 Denmark
-
 Dominican Republic
-
 Ecuador
-
 Egypt
Egypt
-
 El Salvador
-
 Estonia
-
 Eswatini
-
 Ethiopia
-
 Finland
-
 France
-
 Georgia
-
 Germany
-
 Ghana
Ghana
-
 Greece
-
 Haiti
Haiti
-
 Hong Kong
-
 Hungary
-
 India
India
-
 Indonesia
-
 Iran, Islamic republic
-
 Iraq
Iraq
-
 Ireland
-
 Israel
-
 Italy
Italy
-
 Jamaica
-
 Japan
Japan
-
 Jordan
-
 Kazakhstan
-
 Kenya
Kenya
-
 Korea
Korea
-
 Kuwait
-
 Kyrgyzstan
-
 Laos
Laos
-
 Latvia
-
 Lebanon
-
 Lesotho
-
 Libya
Libya
-
 Lithuania
-
 Luxembourg
-
 Madagascar
-
 Malaysia
-
 Malta
Malta
-
 Mauritius
-
 Mexico
-
 Moldova
-
 Mongolia
-
 Montenegro
-
 Morocco
-
 Mozambique
-
 Myanmar
-
 Namibia
-
 Nepal
Nepal
-
 Netherlands
-
 New Zealand
-
 Nigeria
-
 North Macedonia
-
 Norway
-
 Oman
Oman
-
 Pakistan
-
 Palestine
-
 Panama
-
 Papua New Guinea
-
 Paraguay
-
 Peru
Peru
-
 Philippines
-
 Poland
-
 Portugal
-
 Puerto Rico
-
 Qatar
Qatar
-
 Reunion
-
 Romania
-
 Rwanda
-
 Saudi Arabia
-
 Serbia
-
 Singapore
-
 Slovakia
-
 Slovenia
-
 Somalia
-
 South Africa
-
 Spain
Spain
-
 Sri Lanka
-
 Sweden
-
 Switzerland
-
 Syria
Syria
-
 Taiwan
-
 Tajikistan
-
 Tanzania
-
 Thailand
-
 Trinidad and Tobago
-
 Tunisia
-
 Turkey
-
 UAE
UAE
-
 Uganda
-
 Ukraine
-
 United Kingdom
-
United States
-
 Uruguay
-
 Uzbekistan
-
 Venezuela
-
 Vietnam
-
 Yemen
Yemen
-
 Zambia
-
 Zimbabwe
- Forex
- Crypto












