
+7.03% for Celestia as buyers lead a rapid rally

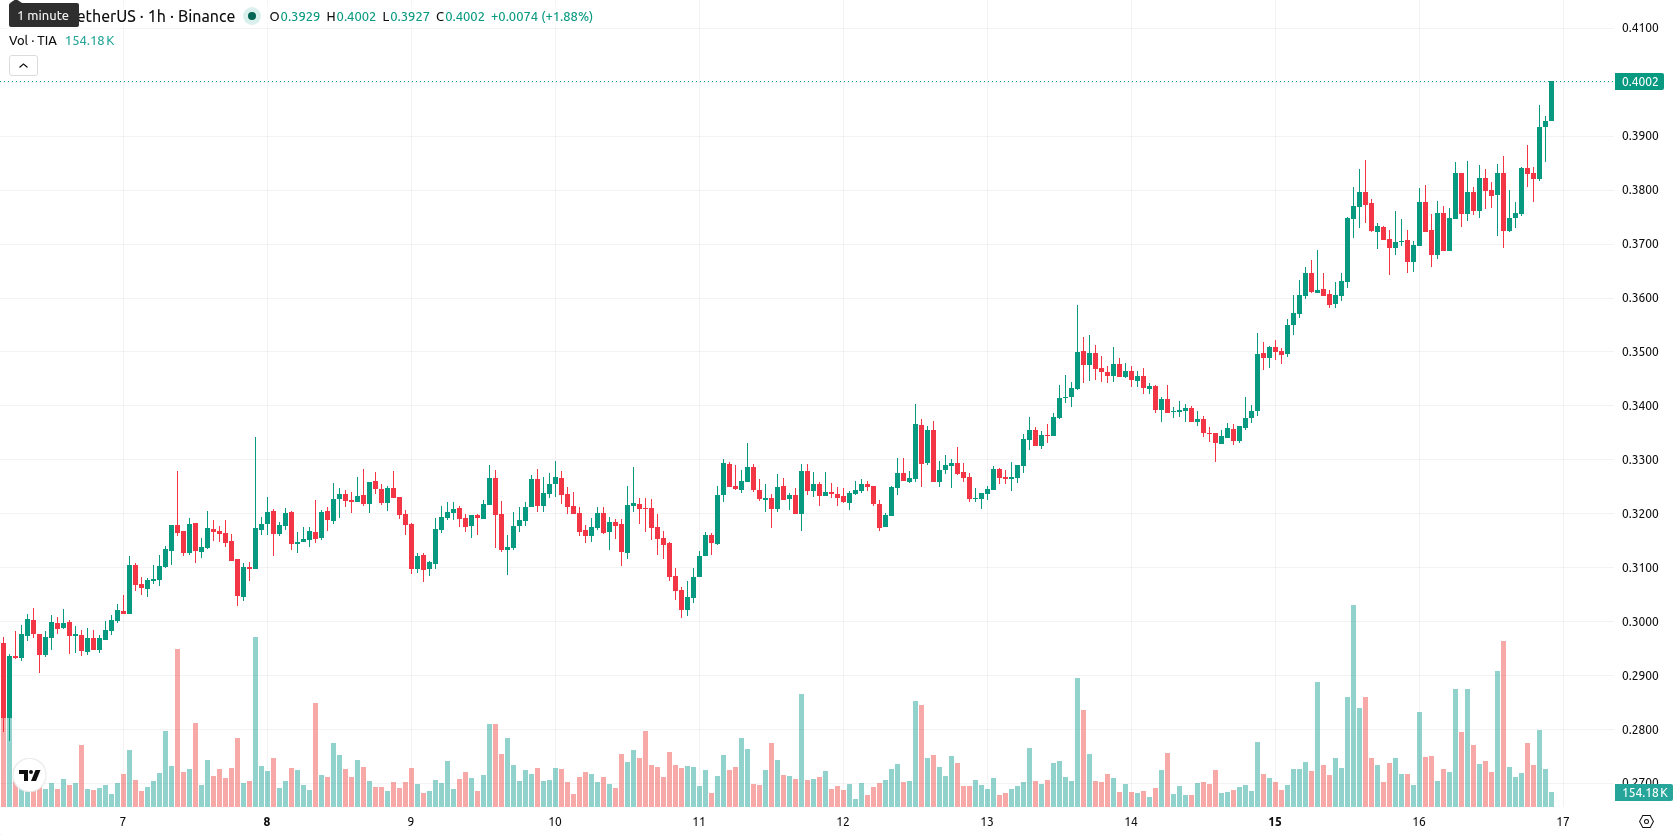
Celestia (TIA) is trading at $0.3976, up 7.03% intraday and sitting above its short- and medium-term moving averages.
Highlights
- TIA/USD demonstrates a short- and medium-term bullish trend but faces sustained long-term downward pressure.
- Strong buying momentum persists, although multiple overbought indicators caution against aggressive chase of the rally.
- TIA/USD is forecast to consolidate between $0.3786 and $0.4166 over the next 2–3 days, with upside moves more probable than declines.
Momentum signals strengthen as TIA faces daily resistance
On the technical front, TIA/USD trades above both the MA-20 and MA-50 on the hourly chart, but remains beneath the MA-200 on the daily timeframe. Immediate support is marked by the Ichimoku Kijun level at $0.3797. MACD, ADX, and Awesome Oscillator jointly indicate strong upside momentum, while RSI reads 62.8 (Buy). However, both the Commodity Channel Index and Stoch RSI are overbought, suggesting that price is extended intraday. Recent action also reflects high volatility and continued buyer dominance according to BBP Buy.
High probability of consolidation amid weak selling pressure
Over the next 2–3 trading days, TIA/USD is likely to consolidate within a typical volatility band ranging from $0.3786 to $0.4166. The probability of an upward move remains very high, with sellers having little presence at current levels. The primary scenario expects ongoing range-bound behavior, while an upside breakout would target the upper end of the band. Conversely, a drop under the $0.3797 support could see price test the lower boundary near $0.3786.
Earlier, analysts noted that Celestia’s technical outlook was mixed, with strong intraday momentum offset by caution over potential reversals. The latest setup confirms renewed buyer dominance amid sustained volatility, so traders should now watch for a decisive move above $0.4166 to signal a fresh bullish breakout.


Latest Celestia News


-
 Afghanistan
-
 Albania
-
 Algeria
-
 Angola
-
 Argentina
-
 Armenia
-
 Australia
-
 Austria
-
 Azerbaijan
-
 Bahamas
-
 Bahrain
-
 Bangladesh
-
 Belarus
-
 Belgium
-
 Bolivia
-
 Botswana
-
 Brazil
-
 Brunei
-
 Bulgaria
-
 Cambodia
-
 Cameroon
-
 Canada
-
 Chile
Chile
-
 China
China
-
 Colombia
-
 Congo
Congo
-
 Costa Rica
-
 Cote d'Ivoire
-
 Croatia
-
 Cuba
Cuba
-
 Cyprus
-
 Czechia
-
 DR Congo
-
 Denmark
-
 Dominican Republic
-
 Ecuador
-
 Egypt
Egypt
-
 El Salvador
-
 Estonia
-
 Eswatini
-
 Ethiopia
-
 Finland
-
 France
-
 Georgia
-
 Germany
-
 Ghana
Ghana
-
 Greece
-
 Haiti
Haiti
-
 Hong Kong
-
 Hungary
-
 India
India
-
 Indonesia
-
 Iran, Islamic republic
-
 Iraq
Iraq
-
 Ireland
-
 Israel
-
 Italy
Italy
-
 Jamaica
-
 Japan
Japan
-
 Jordan
-
 Kazakhstan
-
 Kenya
Kenya
-
 Korea
Korea
-
 Kuwait
-
 Kyrgyzstan
-
 Laos
Laos
-
 Latvia
-
 Lebanon
-
 Lesotho
-
 Libya
Libya
-
 Lithuania
-
 Luxembourg
-
 Madagascar
-
 Malaysia
-
 Malta
Malta
-
 Mauritius
-
 Mexico
-
 Moldova
-
 Mongolia
-
 Montenegro
-
 Morocco
-
 Mozambique
-
 Myanmar
-
 Namibia
-
 Nepal
Nepal
-
 Netherlands
-
 New Zealand
-
 Nigeria
-
 North Macedonia
-
 Norway
-
 Oman
Oman
-
 Pakistan
-
 Palestine
-
 Panama
-
 Papua New Guinea
-
 Paraguay
-
 Peru
Peru
-
 Philippines
-
 Poland
-
 Portugal
-
 Puerto Rico
-
 Qatar
Qatar
-
 Reunion
-
 Romania
-
 Rwanda
-
 Saudi Arabia
-
 Serbia
-
 Singapore
-
 Slovakia
-
 Slovenia
-
 Somalia
-
 South Africa
-
 Spain
Spain
-
 Sri Lanka
-
 Sweden
-
 Switzerland
-
 Syria
Syria
-
 Taiwan
-
 Tajikistan
-
 Tanzania
-
 Thailand
-
 Trinidad and Tobago
-
 Tunisia
-
 Turkey
-
 UAE
UAE
-
 Uganda
-
 Ukraine
-
 United Kingdom
-
United States
-
 Uruguay
-
 Uzbekistan
-
 Venezuela
-
 Vietnam
-
 Yemen
Yemen
-
 Zambia
-
 Zimbabwe
- Forex
- Crypto
