

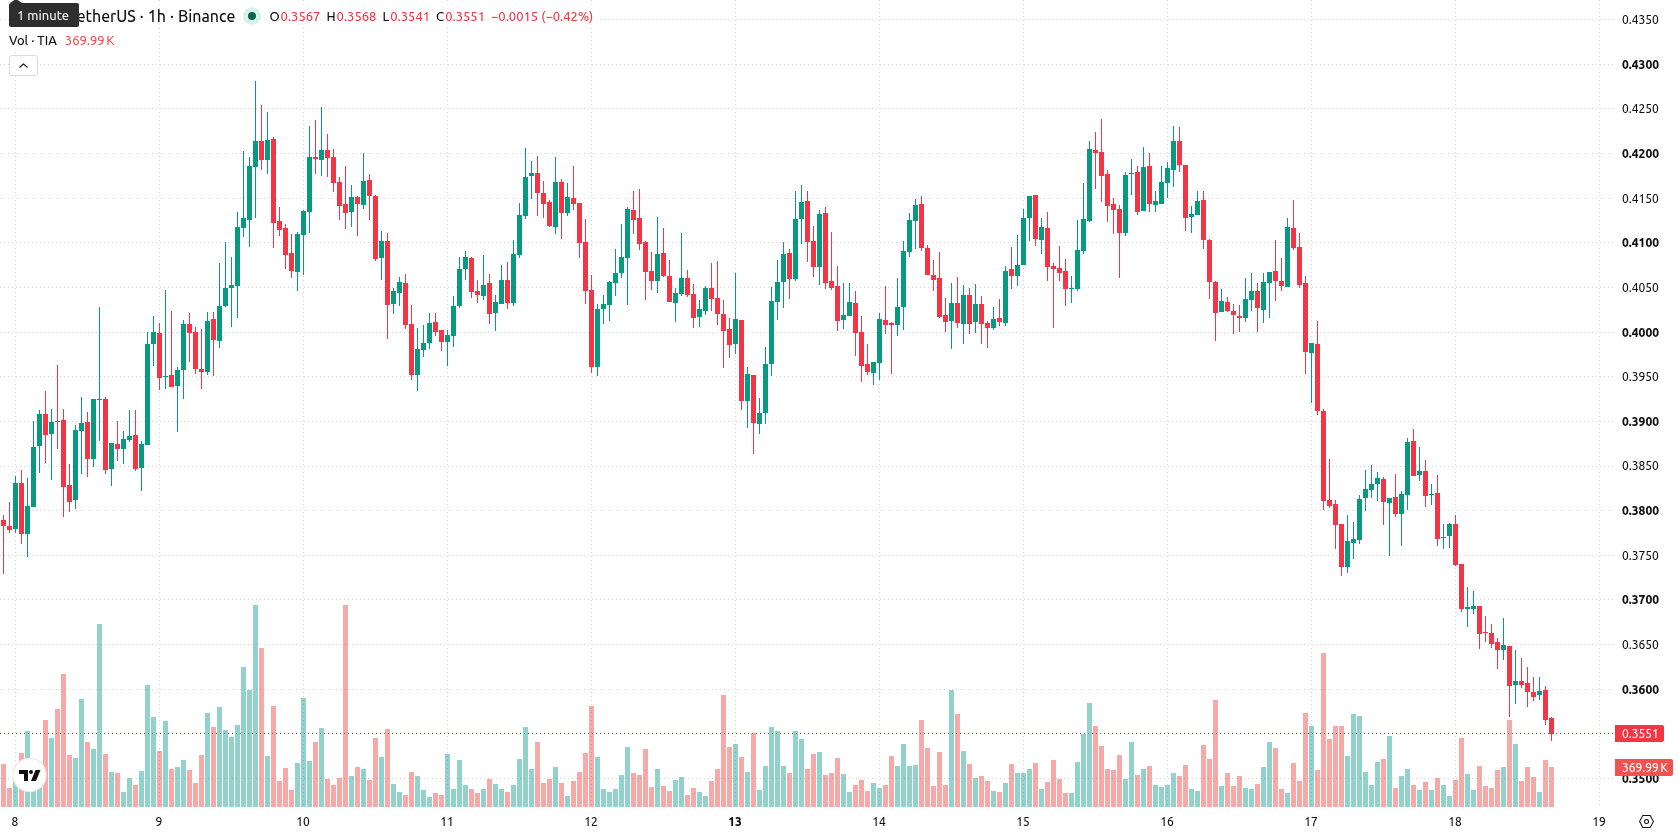
Celestia (TIA) is trading at $0.3549 after dropping 8.13% on the day, underperforming and closing well below its key moving averages. The asset remains pressured within a strong downward daily trend and is positioned beneath both short- and longer-term supports.
 0.3667
0.4238
0.3667
0.4238
Highlights
- Celestia has lost over 98% of its value since its February 2024 peak, severely impacting investor confidence and sentiment.
- Falling trading volume has reduced liquidity, leaving the token increasingly prone to additional selloffs amid ongoing negative sentiment.
- Price remains under sustained bearish pressure, trading below key averages and likely to move within a $0.3435–$0.3663 range barring a break of $0.3725 resistance.
Historic drawdown deepens as confidence wanes and liquidity dries up
According to Diariobitcoin, Celestia has extended a pronounced long-term downtrend, losing over 98% of its value since reaching an all-time high in February 2024. This historic decline has eroded investor confidence and continues to weigh heavily on market sentiment. Additionally, trading volume has decreased, contributing to reduced liquidity and greater vulnerability to further selloffs.
Bearish signals intensify as oscillators and averages turn negative
On the technical front, TIA/USD is trading below the MA-20 at $0.367 and MA-50 at $0.3809 on the hourly chart, as well as beneath the MA-200 at $0.383 on the daily timeframe. The Ichimoku Kijun level at $0.3725 forms immediate resistance. On the hourly chart, the Moving Average Convergence Divergence (MACD) and Average Directional Index (ADX) confirm bearish momentum, while the Relative Strength Index (RSI), Commodity Channel Index (CCI), and Stochastic RSI all register in oversold territory. A Bull/Bear Power Sell signal supports persistent seller dominance, while the Awesome Oscillator is neutral and does not reinforce the ongoing downside pressure.
Limited rebound potential as downside risks dominate short-term trade
In the next two to three trading days, TIA is expected to trade within a range between $0.3435 and $0.3663, reflecting typical volatility from current levels. The probability of an upward reversal is considered very low, with a higher likelihood of continued downside momentum. A bullish scenario would require a sustained break above the $0.3725 resistance, whereas a clear bearish extension could develop if the support at $0.3435 fails.
Earlier, analysts noted that Celestia was entrenched in a persistent downtrend with oversold technical conditions and limited prospects for a bullish reversal. This latest decline and continued seller dominance reinforce the prevailing bearish scenario, making a sustained move above $0.3725 the key threshold for any potential upside shift.


Latest Celestia News






-
 Afghanistan
-
 Albania
-
 Algeria
-
 Angola
-
 Argentina
-
 Armenia
-
 Australia
-
 Austria
-
 Azerbaijan
-
 Bahamas
-
 Bahrain
-
 Bangladesh
-
 Belarus
-
 Belgium
-
 Bolivia
-
 Botswana
-
 Brazil
-
 Brunei
-
 Bulgaria
-
 Cambodia
-
 Cameroon
-
 Canada
-
 Chile
Chile
-
 China
China
-
 Colombia
-
 Congo
Congo
-
 Costa Rica
-
 Cote d'Ivoire
-
 Croatia
-
 Cuba
Cuba
-
 Cyprus
-
 Czechia
-
 DR Congo
-
 Denmark
-
 Dominican Republic
-
 Ecuador
-
 Egypt
Egypt
-
 El Salvador
-
 Estonia
-
 Eswatini
-
 Ethiopia
-
 Finland
-
 France
-
 Georgia
-
 Germany
-
 Ghana
Ghana
-
 Greece
-
 Haiti
Haiti
-
 Hong Kong
-
 Hungary
-
 India
India
-
 Indonesia
-
 Iran, Islamic republic
-
 Iraq
Iraq
-
 Ireland
-
 Israel
-
 Italy
Italy
-
 Jamaica
-
 Japan
Japan
-
 Jordan
-
 Kazakhstan
-
 Kenya
Kenya
-
 Korea
Korea
-
 Kuwait
-
 Kyrgyzstan
-
 Laos
Laos
-
 Latvia
-
 Lebanon
-
 Lesotho
-
 Libya
Libya
-
 Lithuania
-
 Luxembourg
-
 Madagascar
-
 Malaysia
-
 Malta
Malta
-
 Mauritius
-
 Mexico
-
 Moldova
-
 Mongolia
-
 Montenegro
-
 Morocco
-
 Mozambique
-
 Myanmar
-
 Namibia
-
 Nepal
Nepal
-
 Netherlands
-
 New Zealand
-
 Nigeria
-
 North Macedonia
-
 Norway
-
 Oman
Oman
-
 Pakistan
-
 Palestine
-
 Panama
-
 Papua New Guinea
-
 Paraguay
-
 Peru
Peru
-
 Philippines
-
 Poland
-
 Portugal
-
 Puerto Rico
-
 Qatar
Qatar
-
 Reunion
-
 Romania
-
 Rwanda
-
 Saudi Arabia
-
 Serbia
-
 Singapore
-
 Slovakia
-
 Slovenia
-
 Somalia
-
 South Africa
-
 Spain
Spain
-
 Sri Lanka
-
 Sweden
-
 Switzerland
-
 Syria
Syria
-
 Taiwan
-
 Tajikistan
-
 Tanzania
-
 Thailand
-
 Trinidad and Tobago
-
 Tunisia
-
 Turkey
-
 UAE
UAE
-
 Uganda
-
 Ukraine
-
 United Kingdom
-
United States
-
 Uruguay
-
 Uzbekistan
-
 Venezuela
-
 Vietnam
-
 Yemen
Yemen
-
 Zambia
-
 Zimbabwe
- Forex
- Crypto











