
-7.59% for Pepe as recovery attempts remain weak near $0.000002830

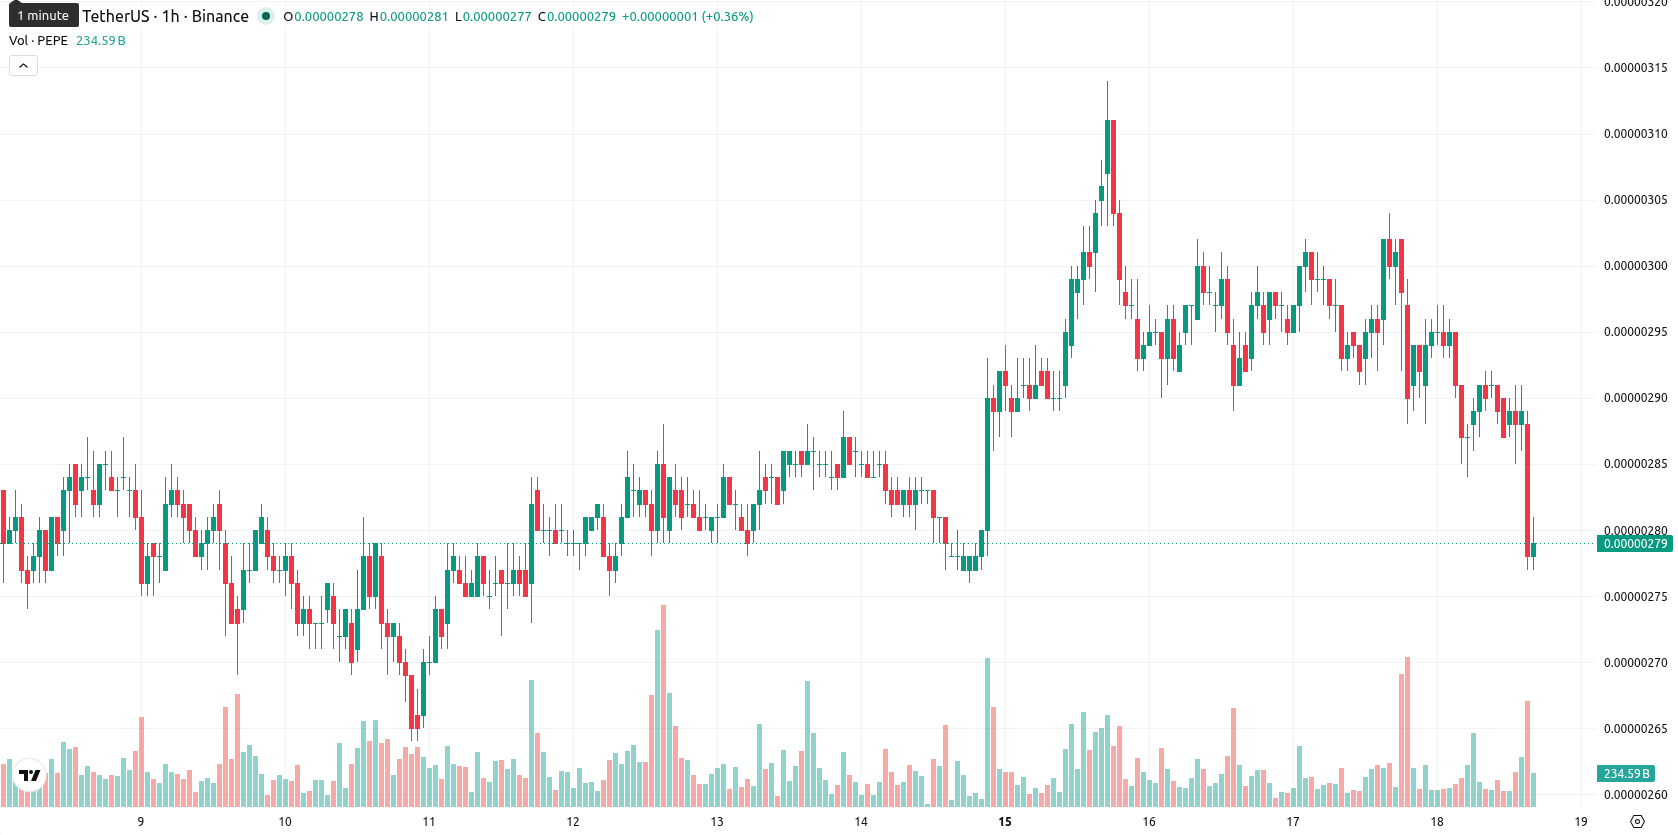
Pepe (PEPE) is trading at $0.000003000, marking a daily decline of 7.59%. The price is currently above its short- to medium-term moving averages, with notable volatility during the session.
Highlights
- Canary Capital's S-1 filing for a spot PEPE ETF marks a significant step toward institutional access if approved.
- Uncertainty over SEC approval persists, while PEPE briefly rallied on positive risk sentiment following the US-Iran peace deal announcement.
- Bearish technical momentum dominates, with price consolidating between $0.000002830 and $0.000003087 and downside probability remaining very high.
ETF filing and geopolitical news fuel mixed sentiment and uncertainty
Canary Capital submitted an S-1 registration to the SEC in April 2026 for what would be the first spot PEPE ETF, marking a formal regulatory step that could eventually broaden market access and institutional participation if approved. The ETF filing set the stage for future product development, but the timeline for a decision has extended uncertainty for investors. Additionally, PEPE was briefly affected by the announcement of a formal US-Iran peace deal on June 16, 2026, which temporarily shifted risk sentiment and supported a short-term rally.
Bearish momentum builds as oscillators and support levels diverge
On the charts, PEPE is positioned above the MA-20 and MA-50 on the hourly timeframe, but remains under the MA-200 on the daily chart. Immediate technical support is defined at the Ichimoku Kijun level of $0.000002915. Momentum indicators, including MACD and ADX, highlight persistent bearish pressure, while the RSI sits at 31, with Stoch RSI and CCI both confirming an oversold condition. Bull/Bear Power shows intraday buyer activity, though the Awesome Oscillator aligns with broader downside momentum. Divergence across oscillators indicates a weak recovery attempt within a prevailing bearish structure.
Downside risks elevated as volatility constrains breakout potential
Looking ahead over the next 2–3 trading days, PEPE is expected to consolidate within a range between $0.000002830 and $0.000003087, reflecting the asset’s current volatility band. The probability for further downside moves remains very high, whereas an upside breakout appears unlikely without a shift in underlying momentum. Should support at $0.000002830 fail, a further bearish move may be triggered, while a sustained push above resistance would be needed for any bullish scenario.
Previously it was reported that Pepe was experiencing persistent bearish momentum alongside prolonged regulatory uncertainty surrounding the proposed spot ETF. The current environment reaffirms these headwinds, making the integrity of support near $0.000002830 a critical short-term gauge for traders monitoring continued downside risk.


-
 Afghanistan
-
 Albania
-
 Algeria
-
 Angola
-
 Argentina
-
 Armenia
-
 Australia
-
 Austria
-
 Azerbaijan
-
 Bahamas
-
 Bahrain
-
 Bangladesh
-
 Belarus
-
 Belgium
-
 Bolivia
-
 Botswana
-
 Brazil
-
 Brunei
-
 Bulgaria
-
 Cambodia
-
 Cameroon
-
 Canada
-
 Chile
Chile
-
 China
China
-
 Colombia
-
 Congo
Congo
-
 Costa Rica
-
 Cote d'Ivoire
-
 Croatia
-
 Cuba
Cuba
-
 Cyprus
-
 Czechia
-
 DR Congo
-
 Denmark
-
 Dominican Republic
-
 Ecuador
-
 Egypt
Egypt
-
 El Salvador
-
 Estonia
-
 Eswatini
-
 Ethiopia
-
 Finland
-
 France
-
 Georgia
-
 Germany
-
 Ghana
Ghana
-
 Greece
-
 Haiti
Haiti
-
 Hong Kong
-
 Hungary
-
 India
India
-
 Indonesia
-
 Iran, Islamic republic
-
 Iraq
Iraq
-
 Ireland
-
 Israel
-
 Italy
Italy
-
 Jamaica
-
 Japan
Japan
-
 Jordan
-
 Kazakhstan
-
 Kenya
Kenya
-
 Korea
Korea
-
 Kuwait
-
 Kyrgyzstan
-
 Laos
Laos
-
 Latvia
-
 Lebanon
-
 Lesotho
-
 Libya
Libya
-
 Lithuania
-
 Luxembourg
-
 Madagascar
-
 Malaysia
-
 Malta
Malta
-
 Mauritius
-
 Mexico
-
 Moldova
-
 Mongolia
-
 Montenegro
-
 Morocco
-
 Mozambique
-
 Myanmar
-
 Namibia
-
 Nepal
Nepal
-
 Netherlands
-
 New Zealand
-
 Nigeria
-
 North Macedonia
-
 Norway
-
 Oman
Oman
-
 Pakistan
-
 Palestine
-
 Panama
-
 Papua New Guinea
-
 Paraguay
-
 Peru
Peru
-
 Philippines
-
 Poland
-
 Portugal
-
 Puerto Rico
-
 Qatar
Qatar
-
 Reunion
-
 Romania
-
 Rwanda
-
 Saudi Arabia
-
 Serbia
-
 Singapore
-
 Slovakia
-
 Slovenia
-
 Somalia
-
 South Africa
-
 Spain
Spain
-
 Sri Lanka
-
 Sweden
-
 Switzerland
-
 Syria
Syria
-
 Taiwan
-
 Tajikistan
-
 Tanzania
-
 Thailand
-
 Trinidad and Tobago
-
 Tunisia
-
 Turkey
-
 UAE
UAE
-
 Uganda
-
 Ukraine
-
 United Kingdom
-
United States
-
 Uruguay
-
 Uzbekistan
-
 Venezuela
-
 Vietnam
-
 Yemen
Yemen
-
 Zambia
-
 Zimbabwe
- Forex
- Crypto
