
Movement advances as bullish momentum returns for buyers

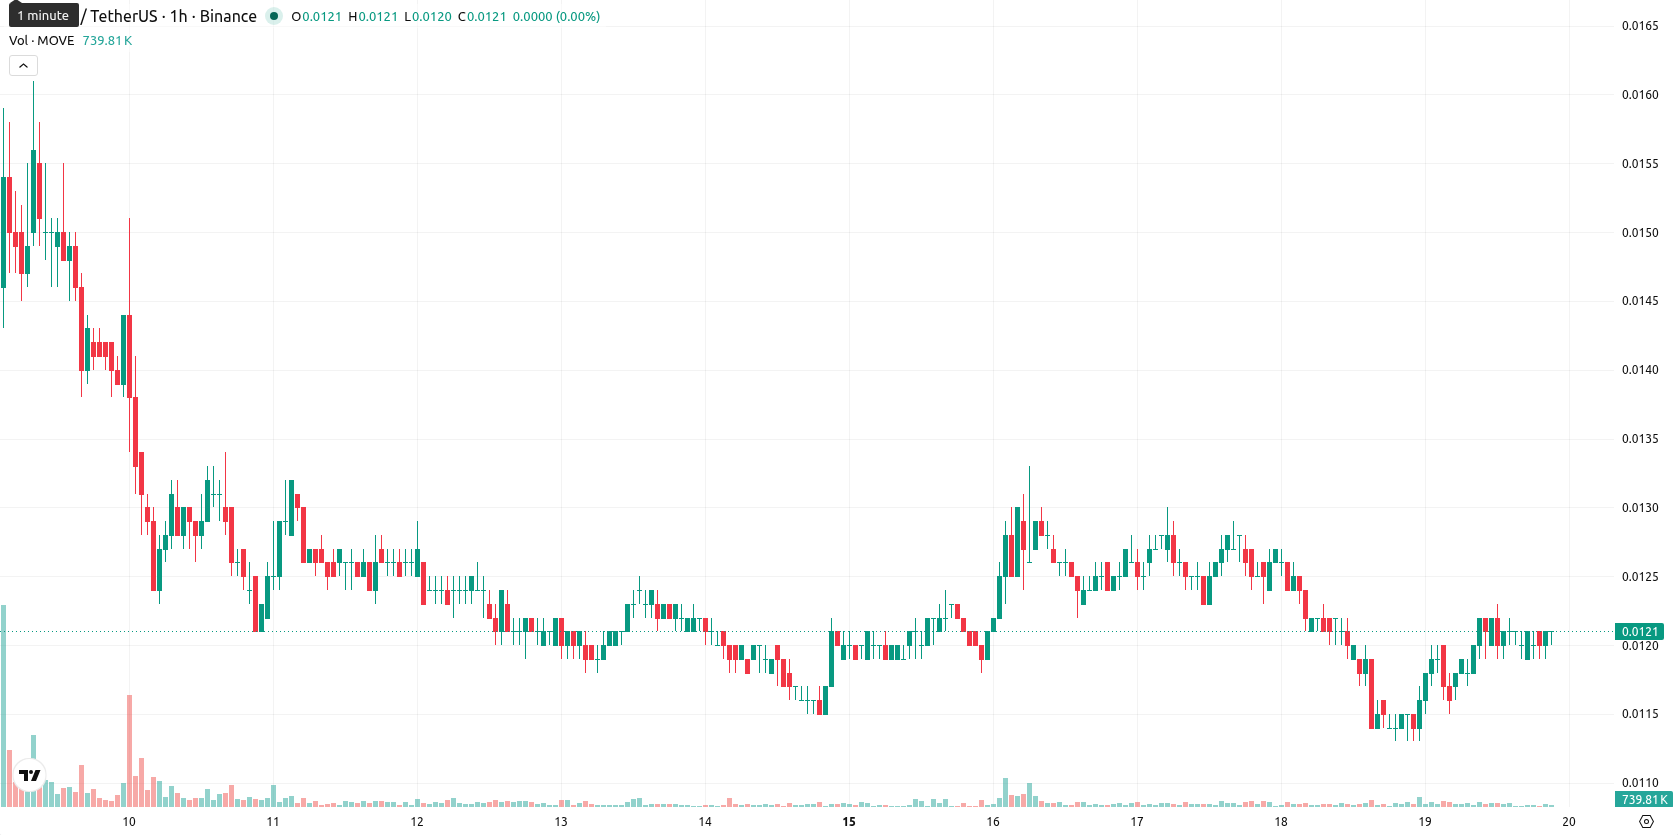
Movement (MOVE) is trading at $0.0121, up 7.08% on the day and moving near the session high. The asset currently sits above its key short- and medium-term moving averages, but remains below its long-term average.
Highlights
- MOVE/USD shows short- and medium-term bullish momentum but retains a long-term bearish technical structure.
- Momentum signals are mixed, with strong MACD buy indications offset by neutral readings from other major oscillators.
- Price is projected to trade between $0.0117 and $0.0125 in the next 2–3 days, with a 75% probability of upside breakout.
Mixed momentum with short-term bullish bias as signal divergence persists
On the daily chart, MOVE trades above the MA-20 and MA-50—both at $0.012—while remaining below the MA-200, which sits at $0.0245. The Ichimoku Kijun is positioned at $0.0118 and serves as immediate support. Momentum readings are mixed: MACD signals a strong buy, ADX is neutral, and RSI is near neutral but leans buy. Stoch RSI and CCI are both neutral, with BBP indicating buyer dominance intraday; the Awesome Oscillator offers no trend confirmation. These technical levels and indicator divergence highlight near-term bullish momentum without decisive trend strength confirmation from all signals.
Bullish edge strengthens as consolidation seen barring key level breaks
Over the next 2–3 trading days, MOVE/USD is expected to fluctuate within a $0.0117 to $0.0125 volatility band relative to current levels. The probability of further upside stands at 75%, making a downside break less likely in the short term. The base scenario calls for consolidation within this corridor. A move above immediate resistance would reflect a bullish scenario, while a break below the Kijun support at $0.0118 would suggest a bearish outcome.
Earlier, analysts noted that bearish momentum and persistent selling pressure continued to dominate Movement’s price action. The current technical setup marks a shift toward near-term bullish momentum, making the $0.0118 Kijun level a pivotal support to watch for confirmation of sustained recovery or renewed downside risk.


-
 Afghanistan
-
 Albania
-
 Algeria
-
 Angola
-
 Argentina
-
 Armenia
-
 Australia
-
 Austria
-
 Azerbaijan
-
 Bahamas
-
 Bahrain
-
 Bangladesh
-
 Belarus
-
 Belgium
-
 Bolivia
-
 Botswana
-
 Brazil
-
 Brunei
-
 Bulgaria
-
 Cambodia
-
 Cameroon
-
 Canada
-
 Chile
Chile
-
 China
China
-
 Colombia
-
 Congo
Congo
-
 Costa Rica
-
 Cote d'Ivoire
-
 Croatia
-
 Cuba
Cuba
-
 Cyprus
-
 Czechia
-
 DR Congo
-
 Denmark
-
 Dominican Republic
-
 Ecuador
-
 Egypt
Egypt
-
 El Salvador
-
 Estonia
-
 Eswatini
-
 Ethiopia
-
 Finland
-
 France
-
 Georgia
-
 Germany
-
 Ghana
Ghana
-
 Greece
-
 Haiti
Haiti
-
 Hong Kong
-
 Hungary
-
 India
India
-
 Indonesia
-
 Iran, Islamic republic
-
 Iraq
Iraq
-
 Ireland
-
 Israel
-
 Italy
Italy
-
 Jamaica
-
 Japan
Japan
-
 Jordan
-
 Kazakhstan
-
 Kenya
Kenya
-
 Korea
Korea
-
 Kuwait
-
 Kyrgyzstan
-
 Laos
Laos
-
 Latvia
-
 Lebanon
-
 Lesotho
-
 Libya
Libya
-
 Lithuania
-
 Luxembourg
-
 Madagascar
-
 Malaysia
-
 Malta
Malta
-
 Mauritius
-
 Mexico
-
 Moldova
-
 Mongolia
-
 Montenegro
-
 Morocco
-
 Mozambique
-
 Myanmar
-
 Namibia
-
 Nepal
Nepal
-
 Netherlands
-
 New Zealand
-
 Nigeria
-
 North Macedonia
-
 Norway
-
 Oman
Oman
-
 Pakistan
-
 Palestine
-
 Panama
-
 Papua New Guinea
-
 Paraguay
-
 Peru
Peru
-
 Philippines
-
 Poland
-
 Portugal
-
 Puerto Rico
-
 Qatar
Qatar
-
 Reunion
-
 Romania
-
 Rwanda
-
 Saudi Arabia
-
 Serbia
-
 Singapore
-
 Slovakia
-
 Slovenia
-
 Somalia
-
 South Africa
-
 Spain
Spain
-
 Sri Lanka
-
 Sweden
-
 Switzerland
-
 Syria
Syria
-
 Taiwan
-
 Tajikistan
-
 Tanzania
-
 Thailand
-
 Trinidad and Tobago
-
 Tunisia
-
 Turkey
-
 UAE
UAE
-
 Uganda
-
 Ukraine
-
 United Kingdom
-
United States
-
 Uruguay
-
 Uzbekistan
-
 Venezuela
-
 Vietnam
-
 Yemen
Yemen
-
 Zambia
-
 Zimbabwe
- Forex
- Crypto
