
What is behind Movement's latest 9.6% price pullback?

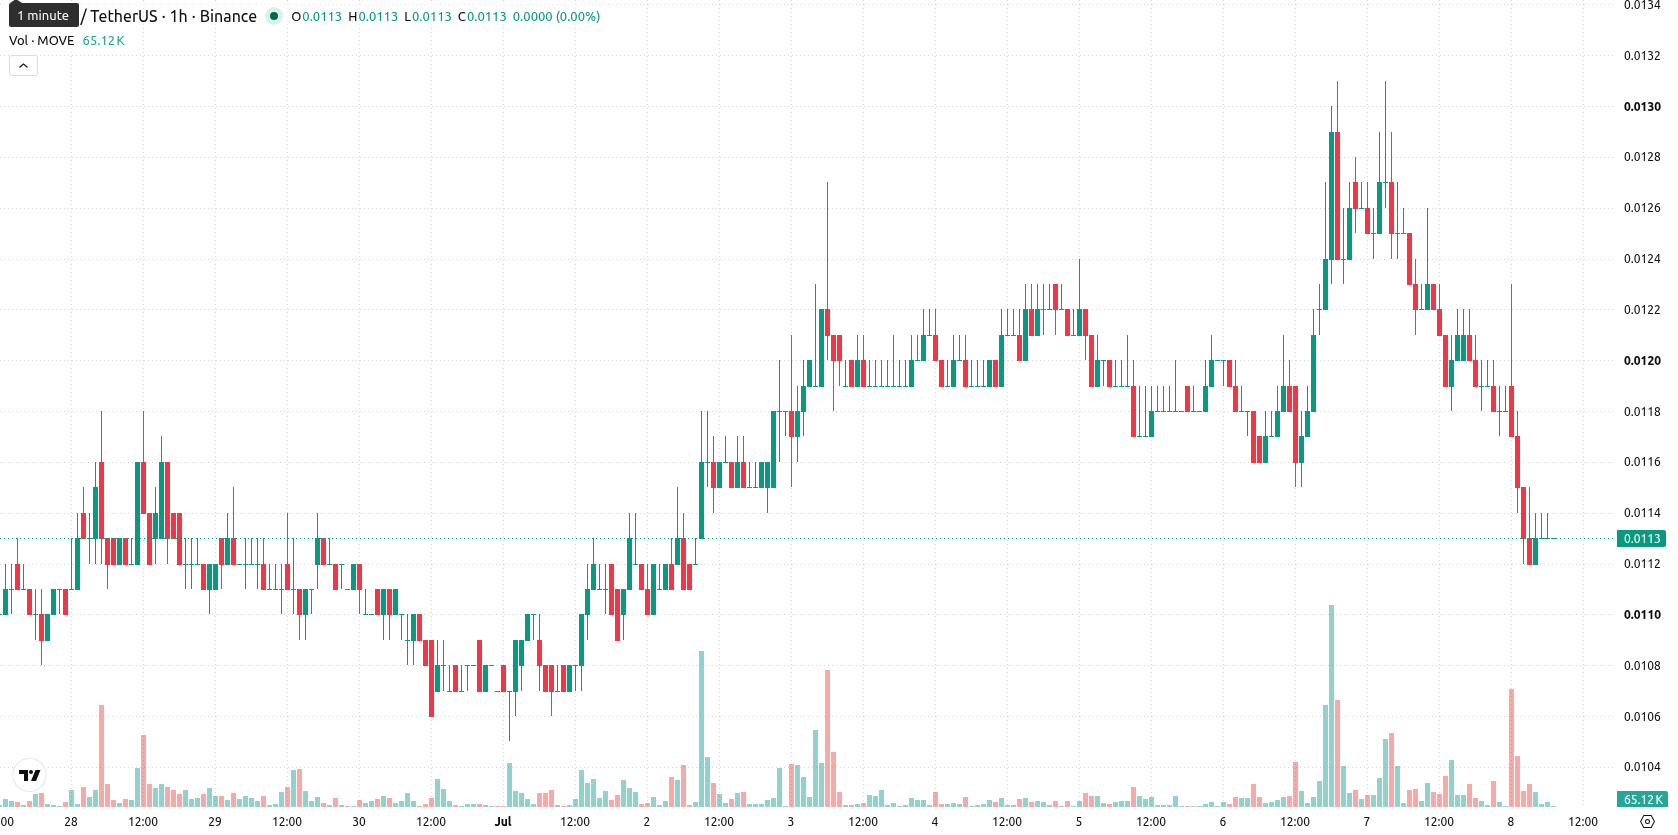
Movement (MOVE) is trading at $0.0113, marking a decline of 9.6% for the day and sitting near session lows. The asset remains below its key moving averages, indicating ongoing downside pressure in the current session.
 0.0123
0.0131
0.0123
0.0131
Highlights
- MOVE/USD remains under strong bearish pressure, consistently trading below major moving averages across multiple timeframes.
- Short-term recovery is capped by immediate resistance at 0.0119, with momentum and trend indicators signaling persistent seller dominance.
- Price is likely to consolidate in the 0.0108–0.0119 range over the next 2–3 days, with higher risk of further downside.
Downtrend intact as key averages and indicators turn negative
On the H1 chart, MOVE is trading below the MA-20 at $0.0118 and MA-50 at $0.012, while the daily MA-200 at $0.0216 stays well above the current price. The Ichimoku Kijun line, positioned at $0.0119, represents immediate overhead resistance for any near-term recovery attempts. Among momentum indicators, the Moving Average Convergence Divergence (MACD) is in Sell mode and the Average Directional Index (ADX) is Neutral. The Relative Strength Index (RSI) remains low at 27, the Stochastic RSI is Neutral, and the Commodity Channel Index (CCI) is Oversold. Bull/Bear Power (BBP) signals strong seller dominance and the Awesome Oscillator also confirms a negative short-term bias.
Downside risk dominates as price tests consolidation range
In the short term, MOVE/USD is expected to consolidate within the $0.0108 to $0.0119 range, reflecting recent volatility band relative to current levels. The most probable scenario is for price action to remain in this range with downward risk prevailing. A break above $0.0119 could open the door to a brief rebound, while failure at $0.0108 support would likely accelerate further selling.
Earlier, analysts noted that Movement was exhibiting strong buyer dominance supported by bullish technical momentum. The latest shift in key technical indicators now signals pronounced seller control, highlighting $0.0108 as a critical support level traders should monitor for potential downside acceleration.














-
 Afghanistan
-
 Albania
-
 Algeria
-
 Angola
-
 Argentina
-
 Armenia
-
 Australia
-
 Austria
-
 Azerbaijan
-
 Bahamas
-
 Bahrain
-
 Bangladesh
-
 Belarus
-
 Belgium
-
 Bolivia
-
 Botswana
-
 Brazil
-
 Brunei
-
 Bulgaria
-
 Cambodia
-
 Cameroon
-
 Canada
-
 Chile
Chile
-
 China
China
-
 Colombia
-
 Congo
Congo
-
 Costa Rica
-
 Cote d'Ivoire
-
 Croatia
-
 Cuba
Cuba
-
 Cyprus
-
 Czechia
-
 DR Congo
-
 Denmark
-
 Dominican Republic
-
 Ecuador
-
 Egypt
Egypt
-
 El Salvador
-
 Estonia
-
 Eswatini
-
 Ethiopia
-
 Finland
-
 France
-
 Georgia
-
 Germany
-
 Ghana
Ghana
-
 Greece
-
 Haiti
Haiti
-
 Hong Kong
-
 Hungary
-
 India
India
-
 Indonesia
-
 Iran, Islamic republic
-
 Iraq
Iraq
-
 Ireland
-
 Israel
-
 Italy
Italy
-
 Jamaica
-
 Japan
Japan
-
 Jordan
-
 Kazakhstan
-
 Kenya
Kenya
-
 Korea
Korea
-
 Kuwait
-
 Kyrgyzstan
-
 Laos
Laos
-
 Latvia
-
 Lebanon
-
 Lesotho
-
 Libya
Libya
-
 Lithuania
-
 Luxembourg
-
 Madagascar
-
 Malaysia
-
 Malta
Malta
-
 Mauritius
-
 Mexico
-
 Moldova
-
 Mongolia
-
 Montenegro
-
 Morocco
-
 Mozambique
-
 Myanmar
-
 Namibia
-
 Nepal
Nepal
-
 Netherlands
-
 New Zealand
-
 Nigeria
-
 North Macedonia
-
 Norway
-
 Oman
Oman
-
 Pakistan
-
 Palestine
-
 Panama
-
 Papua New Guinea
-
 Paraguay
-
 Peru
Peru
-
 Philippines
-
 Poland
-
 Portugal
-
 Puerto Rico
-
 Qatar
Qatar
-
 Reunion
-
 Romania
-
 Rwanda
-
 Saudi Arabia
-
 Serbia
-
 Singapore
-
 Slovakia
-
 Slovenia
-
 Somalia
-
 South Africa
-
 Spain
Spain
-
 Sri Lanka
-
 Sweden
-
 Switzerland
-
 Syria
Syria
-
 Taiwan
-
 Tajikistan
-
 Tanzania
-
 Thailand
-
 Trinidad and Tobago
-
 Tunisia
-
 Turkey
-
 UAE
UAE
-
 Uganda
-
 Ukraine
-
 United Kingdom
-
United States
-
 Uruguay
-
 Uzbekistan
-
 Venezuela
-
 Vietnam
-
 Yemen
Yemen
-
 Zambia
-
 Zimbabwe
- Forex
- Crypto











