
NEXO slides as price stays below key moving averages: weekly outlook

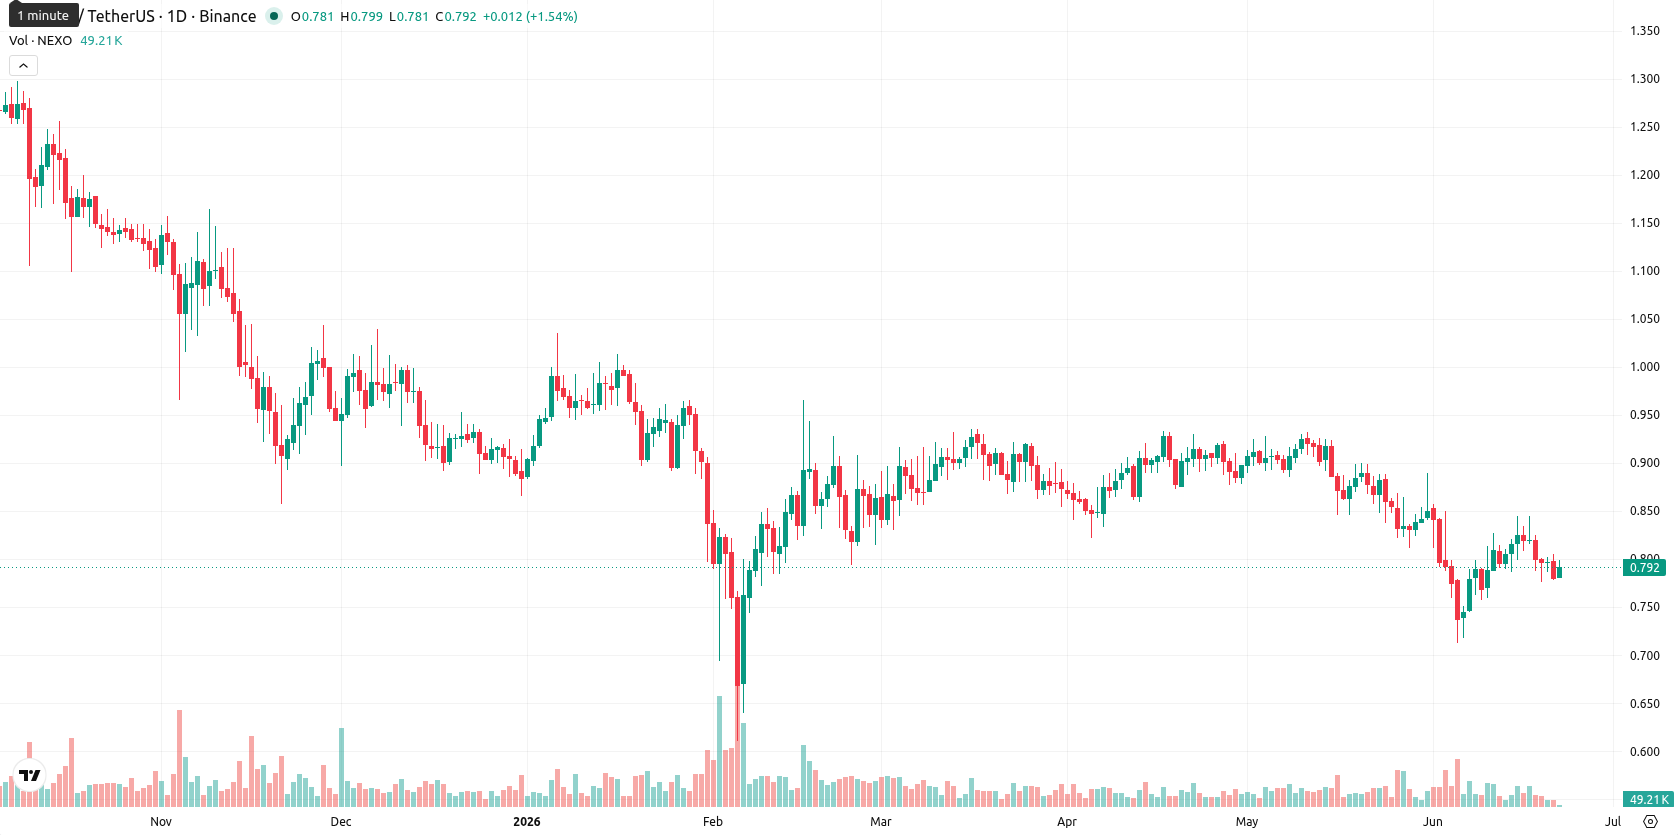
Nexo (NEXO) closed the week at $0.792, dropping $0.0220 or 2.58% over the last seven days and settling towards the lower end of its recent range. The asset remains under notable selling pressure, trading consistently below its key weekly moving averages: MA-20 at $0.8592, MA-50 at $1.0187, and MA-200 at $0.9795, reflecting a persistent lack of bullish momentum.
Highlights
- NEXO faces sustained downside pressure, trading below key weekly moving averages and encountering strong resistance near $0.82.
- Momentum and trend indicators confirm a bearish environment, with sellers maintaining control and no sign of reversal despite oversold signals.
- The projected trading range for the week is $0.7650 to $0.8450, with a high likelihood of sideways or lower price action and less than 20% chance of a rebound.
Downtrend persists as technical indicators reinforce sustained weakness
On the weekly chart, NEXO remains below all significant moving averages, including MA-20, MA-50, and MA-200, emphasizing a prevailing downtrend. The Ichimoku Kijun at $0.8225 acts as immediate resistance, with volatility measured at 8.89% for the week. Weekly oscillators reinforce the bearish environment: MACD and ADX continue to flag ongoing weakness, while RSI, Stochastic RSI, and Commodity Channel Index all indicate oversold levels without showing reversal momentum. Bear Power and the Awesome Oscillator further highlight seller dominance.
Range-bound bias expected as reversal signals remain absent next week
For the next 7 days, NEXO is expected to trade between $0.7650 and $0.8450, with a high probability that sideways or further downside movement will prevail. The projected baseline scenario is consolidation between $0.77 and $0.81, as none of the four main weekly indicators suggest a reversal or buying opportunity. Should a bullish breakout occur above $0.82, the price could briefly target the $0.84 resistance. Conversely, a move under $0.776 would raise risks of revisiting or slightly undercutting the $0.77 region.
Previously it was reported that Nexo expanded its product suite with a corporate account aimed at institutional and business clients, reinforcing its commitment to broadening platform utility. In the context of ongoing technical weakness and consolidation, traders should closely monitor the $0.82 resistance area for potential signs of momentum shift in the coming sessions.


-
 Afghanistan
-
 Albania
-
 Algeria
-
 Angola
-
 Argentina
-
 Armenia
-
 Australia
-
 Austria
-
 Azerbaijan
-
 Bahamas
-
 Bahrain
-
 Bangladesh
-
 Belarus
-
 Belgium
-
 Bolivia
-
 Botswana
-
 Brazil
-
 Brunei
-
 Bulgaria
-
 Cambodia
-
 Cameroon
-
 Canada
-
 Chile
Chile
-
 China
China
-
 Colombia
-
 Congo
Congo
-
 Costa Rica
-
 Cote d'Ivoire
-
 Croatia
-
 Cuba
Cuba
-
 Cyprus
-
 Czechia
-
 DR Congo
-
 Denmark
-
 Dominican Republic
-
 Ecuador
-
 Egypt
Egypt
-
 El Salvador
-
 Estonia
-
 Eswatini
-
 Ethiopia
-
 Finland
-
 France
-
 Georgia
-
 Germany
-
 Ghana
Ghana
-
 Greece
-
 Haiti
Haiti
-
 Hong Kong
-
 Hungary
-
 India
India
-
 Indonesia
-
 Iran, Islamic republic
-
 Iraq
Iraq
-
 Ireland
-
 Israel
-
 Italy
Italy
-
 Jamaica
-
 Japan
Japan
-
 Jordan
-
 Kazakhstan
-
 Kenya
Kenya
-
 Korea
Korea
-
 Kuwait
-
 Kyrgyzstan
-
 Laos
Laos
-
 Latvia
-
 Lebanon
-
 Lesotho
-
 Libya
Libya
-
 Lithuania
-
 Luxembourg
-
 Madagascar
-
 Malaysia
-
 Malta
Malta
-
 Mauritius
-
 Mexico
-
 Moldova
-
 Mongolia
-
 Montenegro
-
 Morocco
-
 Mozambique
-
 Myanmar
-
 Namibia
-
 Nepal
Nepal
-
 Netherlands
-
 New Zealand
-
 Nigeria
-
 North Macedonia
-
 Norway
-
 Oman
Oman
-
 Pakistan
-
 Palestine
-
 Panama
-
 Papua New Guinea
-
 Paraguay
-
 Peru
Peru
-
 Philippines
-
 Poland
-
 Portugal
-
 Puerto Rico
-
 Qatar
Qatar
-
 Reunion
-
 Romania
-
 Rwanda
-
 Saudi Arabia
-
 Serbia
-
 Singapore
-
 Slovakia
-
 Slovenia
-
 Somalia
-
 South Africa
-
 Spain
Spain
-
 Sri Lanka
-
 Sweden
-
 Switzerland
-
 Syria
Syria
-
 Taiwan
-
 Tajikistan
-
 Tanzania
-
 Thailand
-
 Trinidad and Tobago
-
 Tunisia
-
 Turkey
-
 UAE
UAE
-
 Uganda
-
 Ukraine
-
 United Kingdom
-
United States
-
 Uruguay
-
 Uzbekistan
-
 Venezuela
-
 Vietnam
-
 Yemen
Yemen
-
 Zambia
-
 Zimbabwe
- Forex
- Crypto
