
Ethereum price prediction: Will $1,700–$1,783 range contain ETH moves?

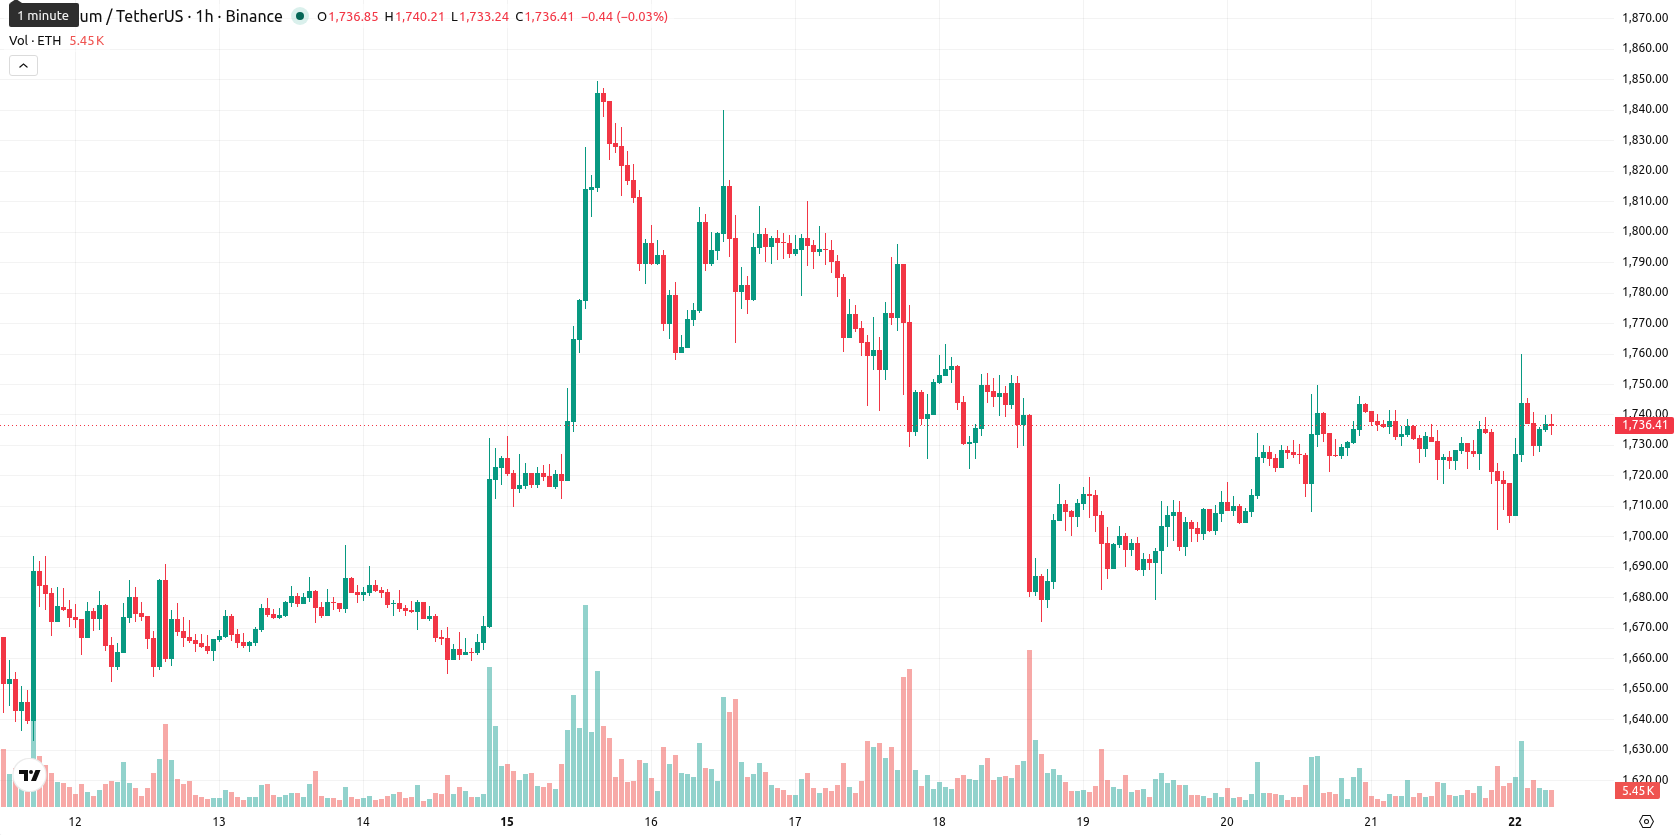
Ethereum (ETH) is trading at $1,737.83, up 0.14% for the day. The price sits above its short- and medium-term moving averages, while long-term momentum remains capped.
Highlights
- Ethereum's network hit a record 13.2 million monthly active addresses and $203.4 billion in tokenized assets, signaling elevated user engagement.
- Core protocol income dropped 82% year-over-year due to fee-reducing upgrades, while management instability and new wallet standards reflect governance shifts.
- ETH/USD trades with near-term upward momentum, but technical signals are mixed; expected to consolidate between $1,700 and $1,783 barring a breakout.
Record user and asset growth offset by income hit and management turnover
Ethereum continues to see robust network activity, reaching a record 13.2 million monthly active addresses and amassing $203.4 billion in tokenized assets, according to Stockstoday, reflecting broad demand and enhanced engagement on the platform. Ongoing network upgrades have led to an 82% year-over-year decline in Layer-1 fee revenue, also reported by Stockstoday, which increases accessibility for users but compresses short-term core protocol income. The Ethereum Foundation is navigating financial constraints and management shifts, including the departure of co-CEO Hsiao-Wei Wang as highlighted by Criptolog, while proposing new signing wallet standards to counter phishing and strengthen transaction transparency, per Newsbtc.
Mixed momentum and support levels highlight indecision amid moderate volatility
On the technical side, ETH trades above the MA-20 and MA-50 on the H1 timeframe, while remaining below the MA-200. The Ichimoku Kijun line at $1,730 establishes immediate support. Momentum readings are mixed: MACD suggests a buy, ADX signals neutral strength, RSI prints 55.2 (tilted positive), and both CCI and Bull/Bear Power (BBP) indicate bullishness; however, Stoch RSI is in overbought territory and the Awesome Oscillator (AO) remains neutral. Volatility is moderate and the asset is trading mid-range for the session, with divergences among indicators flagging some near-term indecision.
Range-bound outlook as breakout risk heightens on volatility shifts
Looking short-term, the expected trading range is $1,700–$1,783, reflecting the typical volatility band relative to current levels. There is a 79% probability of continued upward movement and a 21% chance of a downside move. The baseline scenario calls for consolidation within this band, with an upside breakout likely accelerating gains, while a sustained drop below support could trigger sharper volatility on the downside.
Earlier, analysts noted that Ethereum was exhibiting mixed technical signals and facing macro headwinds such as institutional outflows and security vulnerabilities, contributing to a rangebound outlook. With new data highlighting record network engagement despite compressed protocol revenues and management reshuffles, traders should remain attentive to signs of directional momentum shifts, as a breakout from the current $1,700–$1,783 trading band could catalyze renewed volatility.


Latest Ethereum News


-
 Afghanistan
-
 Albania
-
 Algeria
-
 Angola
-
 Argentina
-
 Armenia
-
 Australia
-
 Austria
-
 Azerbaijan
-
 Bahamas
-
 Bahrain
-
 Bangladesh
-
 Belarus
-
 Belgium
-
 Bolivia
-
 Botswana
-
 Brazil
-
 Brunei
-
 Bulgaria
-
 Cambodia
-
 Cameroon
-
 Canada
-
 Chile
Chile
-
 China
China
-
 Colombia
-
 Congo
Congo
-
 Costa Rica
-
 Cote d'Ivoire
-
 Croatia
-
 Cuba
Cuba
-
 Cyprus
-
 Czechia
-
 DR Congo
-
 Denmark
-
 Dominican Republic
-
 Ecuador
-
 Egypt
Egypt
-
 El Salvador
-
 Estonia
-
 Eswatini
-
 Ethiopia
-
 Finland
-
 France
-
 Georgia
-
 Germany
-
 Ghana
Ghana
-
 Greece
-
 Haiti
Haiti
-
 Hong Kong
-
 Hungary
-
 India
India
-
 Indonesia
-
 Iran, Islamic republic
-
 Iraq
Iraq
-
 Ireland
-
 Israel
-
 Italy
Italy
-
 Jamaica
-
 Japan
Japan
-
 Jordan
-
 Kazakhstan
-
 Kenya
Kenya
-
 Korea
Korea
-
 Kuwait
-
 Kyrgyzstan
-
 Laos
Laos
-
 Latvia
-
 Lebanon
-
 Lesotho
-
 Libya
Libya
-
 Lithuania
-
 Luxembourg
-
 Madagascar
-
 Malaysia
-
 Malta
Malta
-
 Mauritius
-
 Mexico
-
 Moldova
-
 Mongolia
-
 Montenegro
-
 Morocco
-
 Mozambique
-
 Myanmar
-
 Namibia
-
 Nepal
Nepal
-
 Netherlands
-
 New Zealand
-
 Nigeria
-
 North Macedonia
-
 Norway
-
 Oman
Oman
-
 Pakistan
-
 Palestine
-
 Panama
-
 Papua New Guinea
-
 Paraguay
-
 Peru
Peru
-
 Philippines
-
 Poland
-
 Portugal
-
 Puerto Rico
-
 Qatar
Qatar
-
 Reunion
-
 Romania
-
 Rwanda
-
 Saudi Arabia
-
 Serbia
-
 Singapore
-
 Slovakia
-
 Slovenia
-
 Somalia
-
 South Africa
-
 Spain
Spain
-
 Sri Lanka
-
 Sweden
-
 Switzerland
-
 Syria
Syria
-
 Taiwan
-
 Tajikistan
-
 Tanzania
-
 Thailand
-
 Trinidad and Tobago
-
 Tunisia
-
 Turkey
-
 UAE
UAE
-
 Uganda
-
 Ukraine
-
 United Kingdom
-
United States
-
 Uruguay
-
 Uzbekistan
-
 Venezuela
-
 Vietnam
-
 Yemen
Yemen
-
 Zambia
-
 Zimbabwe
- Forex
- Crypto
