
Sonic falls 11.59% as sellers drive price closer to session lows

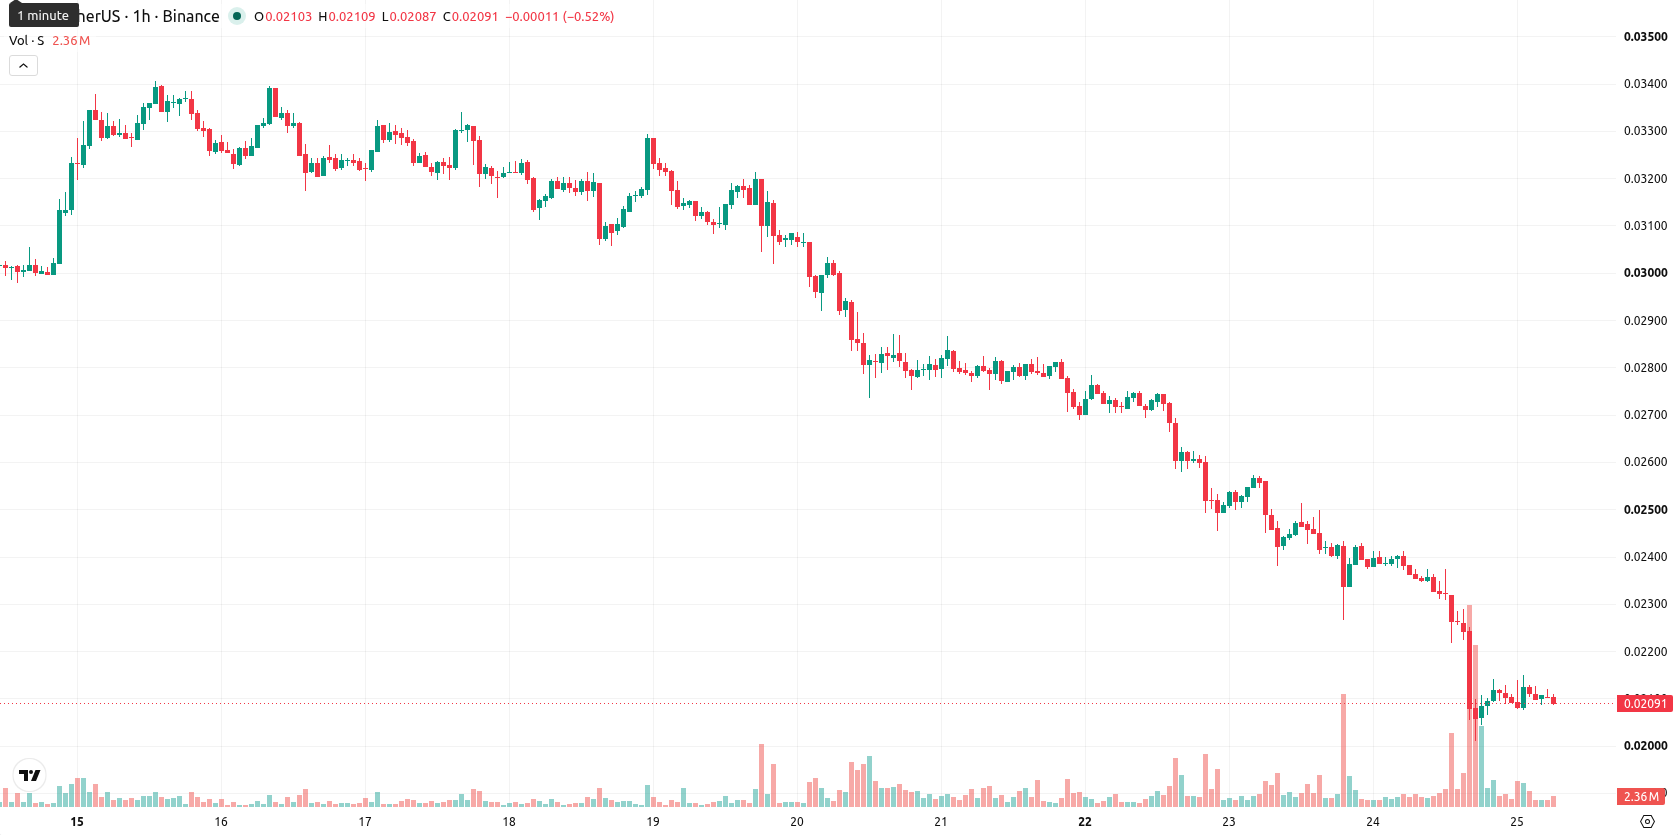
Sonic (S) is trading at $0.0209, marking a 11.59% decline for the day. The price sits below its key moving averages, maintaining a position that suggests persistent downside pressure during the session.
Highlights
- Sonic trades well below all key moving averages, indicating persistent bearish pressure across both short and long timeframes.
- Momentum and trend indicators present a strong downside bias, with sellers controlling intraday action and volatility elevated.
- Price is expected to consolidate between $0.0181 and $0.0237 over the next few days, with strong downside risk prevailing.
Multi-indicator bearish momentum as resistance limits recovery
On the technical front, S is positioned below the MA-20 at $0.0216 and MA-50 at $0.0231 on the hourly chart, with price action well under the long-term MA-200 at $0.0526 on the daily timeframe. Immediate resistance is located at the Ichimoku Kijun level of $0.0221. The Moving Average Convergence Divergence (MACD) signals Strong Sell, while the Average Directional Index (ADX) also suggests a Sell. The Relative Strength Index (RSI) stands at 32.19, reflecting a bearish bias but not yet oversold territory; meanwhile, Stochastic RSI indicates an overbought condition and the Commodity Channel Index (CCI) is Neutral. Bull/Bear Power captures intraday seller dominance, with price activity near today's low amid notable volatility.
High downside risk as sideways range traps short-term outlook
Over the next 2 to 3 days, S is expected to trade within the $0.0181 to $0.0237 range, which encompasses its typical volatility band relative to current levels. The probability of an upward move is assessed as very low, while the risk of further declines remains high. Baseline expectations call for sideways consolidation, though a break above immediate resistance could trigger a bounce, while a drop below support may open the way for additional downside.
Earlier, analysts noted that Sonic continued to face persistent selling momentum and a broadly bearish technical setup. Current developments reinforce this negative outlook, with elevated downside risk making a decisive break below support a key risk for traders to monitor in the near term.


-
 Afghanistan
-
 Albania
-
 Algeria
-
 Angola
-
 Argentina
-
 Armenia
-
 Australia
-
 Austria
-
 Azerbaijan
-
 Bahamas
-
 Bahrain
-
 Bangladesh
-
 Belarus
-
 Belgium
-
 Bolivia
-
 Botswana
-
 Brazil
-
 Brunei
-
 Bulgaria
-
 Cambodia
-
 Cameroon
-
 Canada
-
 Chile
Chile
-
 China
China
-
 Colombia
-
 Congo
Congo
-
 Costa Rica
-
 Cote d'Ivoire
-
 Croatia
-
 Cuba
Cuba
-
 Cyprus
-
 Czechia
-
 DR Congo
-
 Denmark
-
 Dominican Republic
-
 Ecuador
-
 Egypt
Egypt
-
 El Salvador
-
 Estonia
-
 Eswatini
-
 Ethiopia
-
 Finland
-
 France
-
 Georgia
-
 Germany
-
 Ghana
Ghana
-
 Greece
-
 Haiti
Haiti
-
 Hong Kong
-
 Hungary
-
 India
India
-
 Indonesia
-
 Iran, Islamic republic
-
 Iraq
Iraq
-
 Ireland
-
 Israel
-
 Italy
Italy
-
 Jamaica
-
 Japan
Japan
-
 Jordan
-
 Kazakhstan
-
 Kenya
Kenya
-
 Korea
Korea
-
 Kuwait
-
 Kyrgyzstan
-
 Laos
Laos
-
 Latvia
-
 Lebanon
-
 Lesotho
-
 Libya
Libya
-
 Lithuania
-
 Luxembourg
-
 Madagascar
-
 Malaysia
-
 Malta
Malta
-
 Mauritius
-
 Mexico
-
 Moldova
-
 Mongolia
-
 Montenegro
-
 Morocco
-
 Mozambique
-
 Myanmar
-
 Namibia
-
 Nepal
Nepal
-
 Netherlands
-
 New Zealand
-
 Nigeria
-
 North Macedonia
-
 Norway
-
 Oman
Oman
-
 Pakistan
-
 Palestine
-
 Panama
-
 Papua New Guinea
-
 Paraguay
-
 Peru
Peru
-
 Philippines
-
 Poland
-
 Portugal
-
 Puerto Rico
-
 Qatar
Qatar
-
 Reunion
-
 Romania
-
 Rwanda
-
 Saudi Arabia
-
 Serbia
-
 Singapore
-
 Slovakia
-
 Slovenia
-
 Somalia
-
 South Africa
-
 Spain
Spain
-
 Sri Lanka
-
 Sweden
-
 Switzerland
-
 Syria
Syria
-
 Taiwan
-
 Tajikistan
-
 Tanzania
-
 Thailand
-
 Trinidad and Tobago
-
 Tunisia
-
 Turkey
-
 UAE
UAE
-
 Uganda
-
 Ukraine
-
 United Kingdom
-
United States
-
 Uruguay
-
 Uzbekistan
-
 Venezuela
-
 Vietnam
-
 Yemen
Yemen
-
 Zambia
-
 Zimbabwe
- Forex
- Crypto
