
Pepe slides as price stays well below long-term average

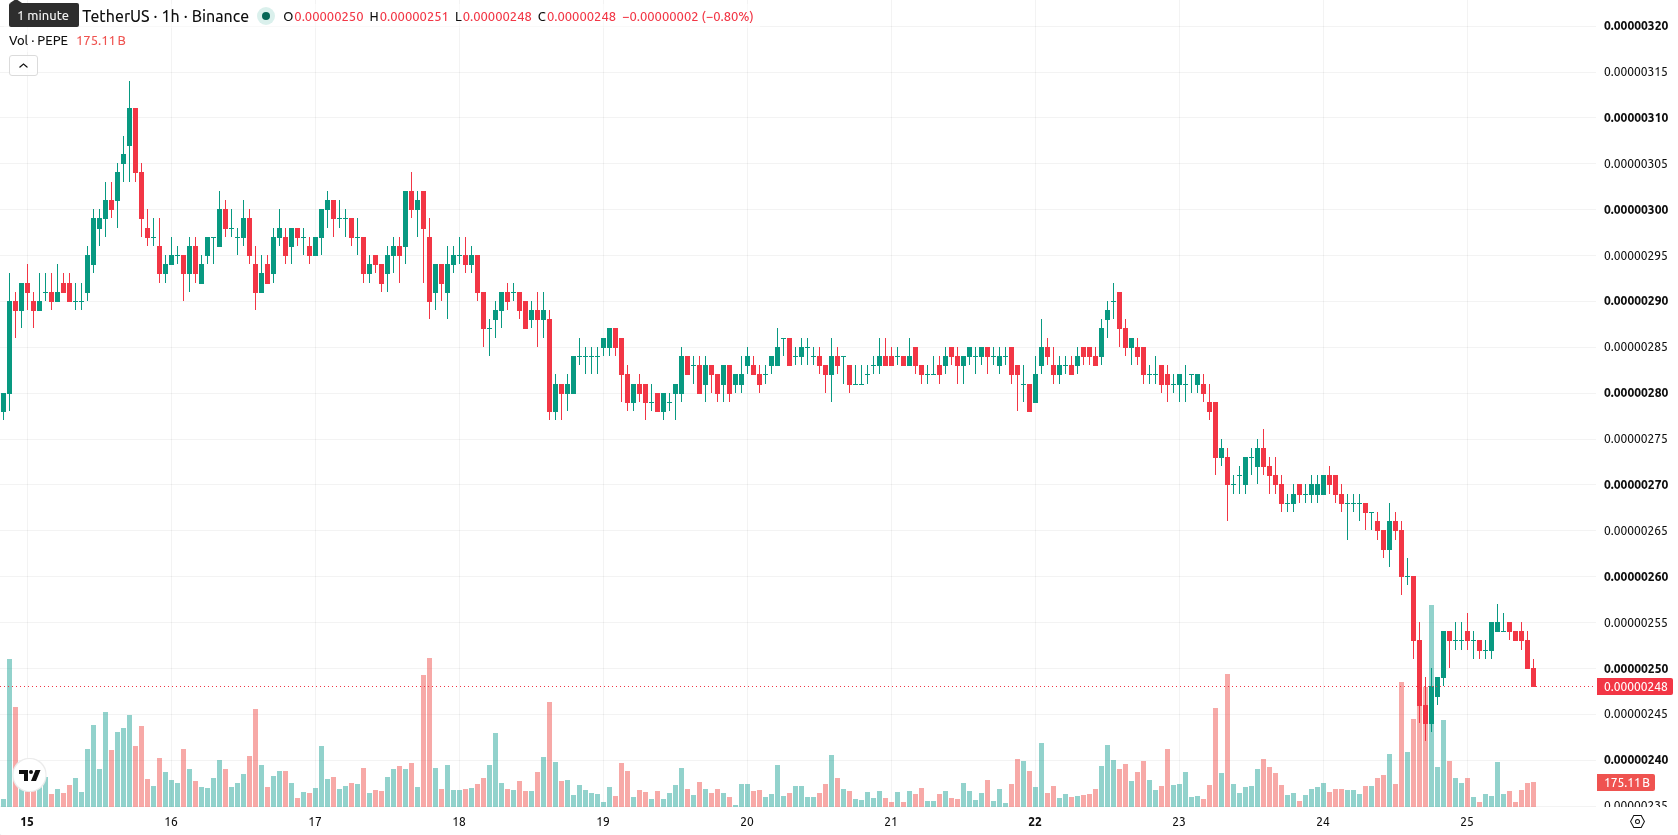
Pepe (PEPE) is trading at $0.0000025, down 7.46% on the day. The token currently sits below its key moving averages, reflecting short-term pressure.
Highlights
- PEPE/USD remains under persistent bearish pressure, trading below short-, medium-, and long-term moving averages.
- Momentum indicators overwhelmingly signal continued downside, with some short-term oscillator divergence causing uncertainty.
- Expected trading range for the next 2–3 days is $0.000002388 to $0.000002612, with high risk of further declines if support breaks.
Momentum weakness and bearish signals amid technical resistance
On the hourly chart, PEPE/USD remains below the MA-20 at $0.000002519 and MA-50 at $0.000002618, with long-term pressure evident as the price trades well below the MA-200 at $0.000003977. The Ichimoku Kijun at $0.00000255 serves as immediate resistance. Momentum signals are weak: Moving Average Convergence Divergence (MACD) remains in strong sell territory and Average Directional Index (ADX) also signals a sell. The Relative Strength Index (RSI) is at 34.94, consistent with a sell signal, and the Stochastic RSI is in the oversold zone. Commodity Channel Index (CCI) is neutral, indicating some indecision among oscillators, while Bull/Bear Power points to a mild buyer response. Despite this, the asset continues to hover near today's low of $0.0000025 amid high volatility and a slight downside gap. The divergence between RSI, CCI, and Bull/Bear Power highlights near-term uncertainty, but momentum remains decisively negative.
Elevated downside risk as price struggles to regain resistance
Over the next 2–3 trading days, PEPE/USD is expected to range between $0.000002388 and $0.000002612, in line with typical volatility bands for the asset. The likelihood of a move higher is low, while downside risks are elevated. If the price breaks above $0.00000255 (the Ichimoku Kijun resistance), a recovery scenario could emerge, whereas a drop below $0.000002388 would likely expose further downside.
Earlier, analysts noted that Pepe was experiencing persistent bearish momentum and limited prospects for a reversal. The current technical setup reinforces this broader outlook, with traders advised to monitor for a decisive move above $0.00000255 or below $0.000002388 as signals for the next directional trend.


-
 Afghanistan
-
 Albania
-
 Algeria
-
 Angola
-
 Argentina
-
 Armenia
-
 Australia
-
 Austria
-
 Azerbaijan
-
 Bahamas
-
 Bahrain
-
 Bangladesh
-
 Belarus
-
 Belgium
-
 Bolivia
-
 Botswana
-
 Brazil
-
 Brunei
-
 Bulgaria
-
 Cambodia
-
 Cameroon
-
 Canada
-
 Chile
Chile
-
 China
China
-
 Colombia
-
 Congo
Congo
-
 Costa Rica
-
 Cote d'Ivoire
-
 Croatia
-
 Cuba
Cuba
-
 Cyprus
-
 Czechia
-
 DR Congo
-
 Denmark
-
 Dominican Republic
-
 Ecuador
-
 Egypt
Egypt
-
 El Salvador
-
 Estonia
-
 Eswatini
-
 Ethiopia
-
 Finland
-
 France
-
 Georgia
-
 Germany
-
 Ghana
Ghana
-
 Greece
-
 Haiti
Haiti
-
 Hong Kong
-
 Hungary
-
 India
India
-
 Indonesia
-
 Iran, Islamic republic
-
 Iraq
Iraq
-
 Ireland
-
 Israel
-
 Italy
Italy
-
 Jamaica
-
 Japan
Japan
-
 Jordan
-
 Kazakhstan
-
 Kenya
Kenya
-
 Korea
Korea
-
 Kuwait
-
 Kyrgyzstan
-
 Laos
Laos
-
 Latvia
-
 Lebanon
-
 Lesotho
-
 Libya
Libya
-
 Lithuania
-
 Luxembourg
-
 Madagascar
-
 Malaysia
-
 Malta
Malta
-
 Mauritius
-
 Mexico
-
 Moldova
-
 Mongolia
-
 Montenegro
-
 Morocco
-
 Mozambique
-
 Myanmar
-
 Namibia
-
 Nepal
Nepal
-
 Netherlands
-
 New Zealand
-
 Nigeria
-
 North Macedonia
-
 Norway
-
 Oman
Oman
-
 Pakistan
-
 Palestine
-
 Panama
-
 Papua New Guinea
-
 Paraguay
-
 Peru
Peru
-
 Philippines
-
 Poland
-
 Portugal
-
 Puerto Rico
-
 Qatar
Qatar
-
 Reunion
-
 Romania
-
 Rwanda
-
 Saudi Arabia
-
 Serbia
-
 Singapore
-
 Slovakia
-
 Slovenia
-
 Somalia
-
 South Africa
-
 Spain
Spain
-
 Sri Lanka
-
 Sweden
-
 Switzerland
-
 Syria
Syria
-
 Taiwan
-
 Tajikistan
-
 Tanzania
-
 Thailand
-
 Trinidad and Tobago
-
 Tunisia
-
 Turkey
-
 UAE
UAE
-
 Uganda
-
 Ukraine
-
 United Kingdom
-
United States
-
 Uruguay
-
 Uzbekistan
-
 Venezuela
-
 Vietnam
-
 Yemen
Yemen
-
 Zambia
-
 Zimbabwe
- Forex
- Crypto
