
-7.01% for Celestia as price remains under $0.3792 resistance

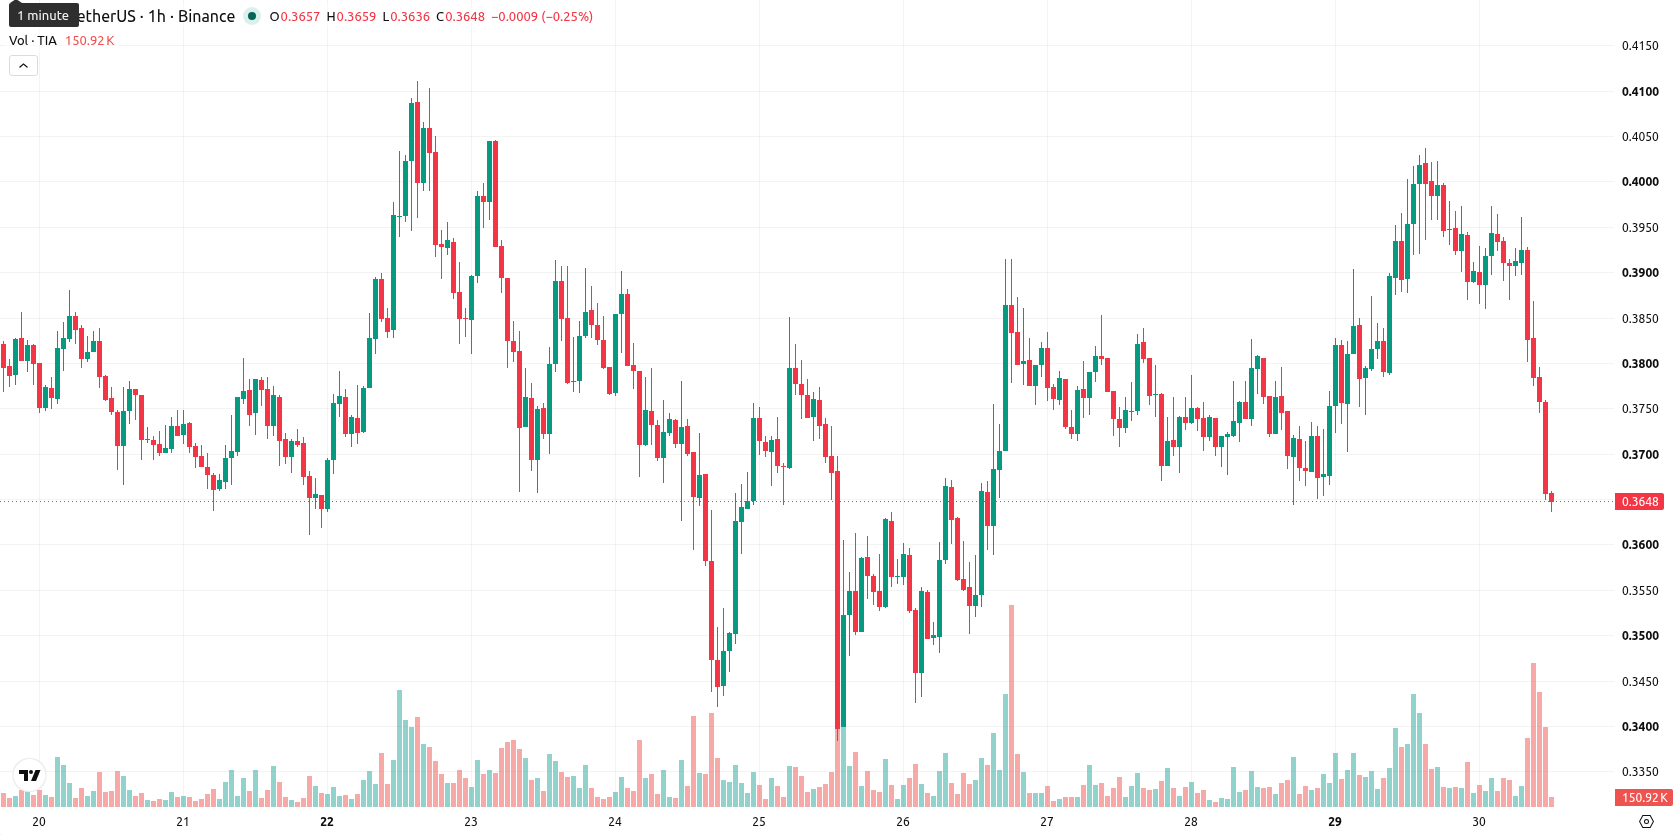
Celestia (TIA) is trading at $0.3646, down 7.01% on the day, currently positioned below its key moving averages.
Highlights
- TIA/USD trades below key moving averages across all timeframes, confirming sustained bearish pressure in the near term.
- Momentum and volatility indicators signal a pronounced oversold condition, but sellers remain in firm control of price action.
- Over the next 2–3 days, price is expected to consolidate between $0.35 and $0.3792, with further downside risk if $0.35 breaks.
Downward momentum persists as oversold signals and high volatility emerge
On the hourly chart, TIA/USD trades below the MA-20 at $0.3897 and the MA-50 at $0.3841. On the daily timeframe, the price is also below the long-term MA-200 at $0.3913, while the Ichimoku Kijun line marks immediate resistance at $0.3857. The Moving Average Convergence Divergence (MACD) is in Sell mode, and the Average Directional Index (ADX) is Neutral, indicating negative momentum with some uncertainty in trend strength. The Relative Strength Index (RSI) stands at 29.62, and both the Stochastic RSI and Commodity Channel Index (CCI) signal oversold conditions. Bull/Bear Power (BBP) also registers Sell, while the Awesome Oscillator highlights a persistent downward trend. Volatility is high, with prices trading near today’s session low.
Downside risks heightened as consolidation limits recovery potential
Over the next 2 to 3 trading days, TIA is expected to fluctuate within the $0.35 to $0.3792 range. The probability of upward movement is very low, and a downward move is highly likely. The baseline scenario points to consolidation inside this volatility band. If TIA breaks above the Ichimoku Kijun level at $0.3857, a recovery may develop. Conversely, a drop below $0.35 would open the door to further downside risk.
Earlier, analysts noted that Celestia was experiencing a momentum shift with a bias toward consolidation amid mixed technical signals. The current breakdown below all key moving averages marks a clear deterioration in trend strength, making the $0.35 support crucial to watch for potential further downside in the coming days.


Latest Celestia News


-
 Afghanistan
-
 Albania
-
 Algeria
-
 Angola
-
 Argentina
-
 Armenia
-
 Australia
-
 Austria
-
 Azerbaijan
-
 Bahamas
-
 Bahrain
-
 Bangladesh
-
 Belarus
-
 Belgium
-
 Bolivia
-
 Botswana
-
 Brazil
-
 Brunei
-
 Bulgaria
-
 Cambodia
-
 Cameroon
-
 Canada
-
 Chile
Chile
-
 China
China
-
 Colombia
-
 Congo
Congo
-
 Costa Rica
-
 Cote d'Ivoire
-
 Croatia
-
 Cuba
Cuba
-
 Cyprus
-
 Czechia
-
 DR Congo
-
 Denmark
-
 Dominican Republic
-
 Ecuador
-
 Egypt
Egypt
-
 El Salvador
-
 Estonia
-
 Eswatini
-
 Ethiopia
-
 Finland
-
 France
-
 Georgia
-
 Germany
-
 Ghana
Ghana
-
 Greece
-
 Haiti
Haiti
-
 Hong Kong
-
 Hungary
-
 India
India
-
 Indonesia
-
 Iran, Islamic republic
-
 Iraq
Iraq
-
 Ireland
-
 Israel
-
 Italy
Italy
-
 Jamaica
-
 Japan
Japan
-
 Jordan
-
 Kazakhstan
-
 Kenya
Kenya
-
 Korea
Korea
-
 Kuwait
-
 Kyrgyzstan
-
 Laos
Laos
-
 Latvia
-
 Lebanon
-
 Lesotho
-
 Libya
Libya
-
 Lithuania
-
 Luxembourg
-
 Madagascar
-
 Malaysia
-
 Malta
Malta
-
 Mauritius
-
 Mexico
-
 Moldova
-
 Mongolia
-
 Montenegro
-
 Morocco
-
 Mozambique
-
 Myanmar
-
 Namibia
-
 Nepal
Nepal
-
 Netherlands
-
 New Zealand
-
 Nigeria
-
 North Macedonia
-
 Norway
-
 Oman
Oman
-
 Pakistan
-
 Palestine
-
 Panama
-
 Papua New Guinea
-
 Paraguay
-
 Peru
Peru
-
 Philippines
-
 Poland
-
 Portugal
-
 Puerto Rico
-
 Qatar
Qatar
-
 Reunion
-
 Romania
-
 Rwanda
-
 Saudi Arabia
-
 Serbia
-
 Singapore
-
 Slovakia
-
 Slovenia
-
 Somalia
-
 South Africa
-
 Spain
Spain
-
 Sri Lanka
-
 Sweden
-
 Switzerland
-
 Syria
Syria
-
 Taiwan
-
 Tajikistan
-
 Tanzania
-
 Thailand
-
 Trinidad and Tobago
-
 Tunisia
-
 Turkey
-
 UAE
UAE
-
 Uganda
-
 Ukraine
-
 United Kingdom
-
United States
-
 Uruguay
-
 Uzbekistan
-
 Venezuela
-
 Vietnam
-
 Yemen
Yemen
-
 Zambia
-
 Zimbabwe
- Forex
- Crypto
