
Solana holds gains but faces ongoing bearish momentum as MACD signals strong sell: weekly analysis

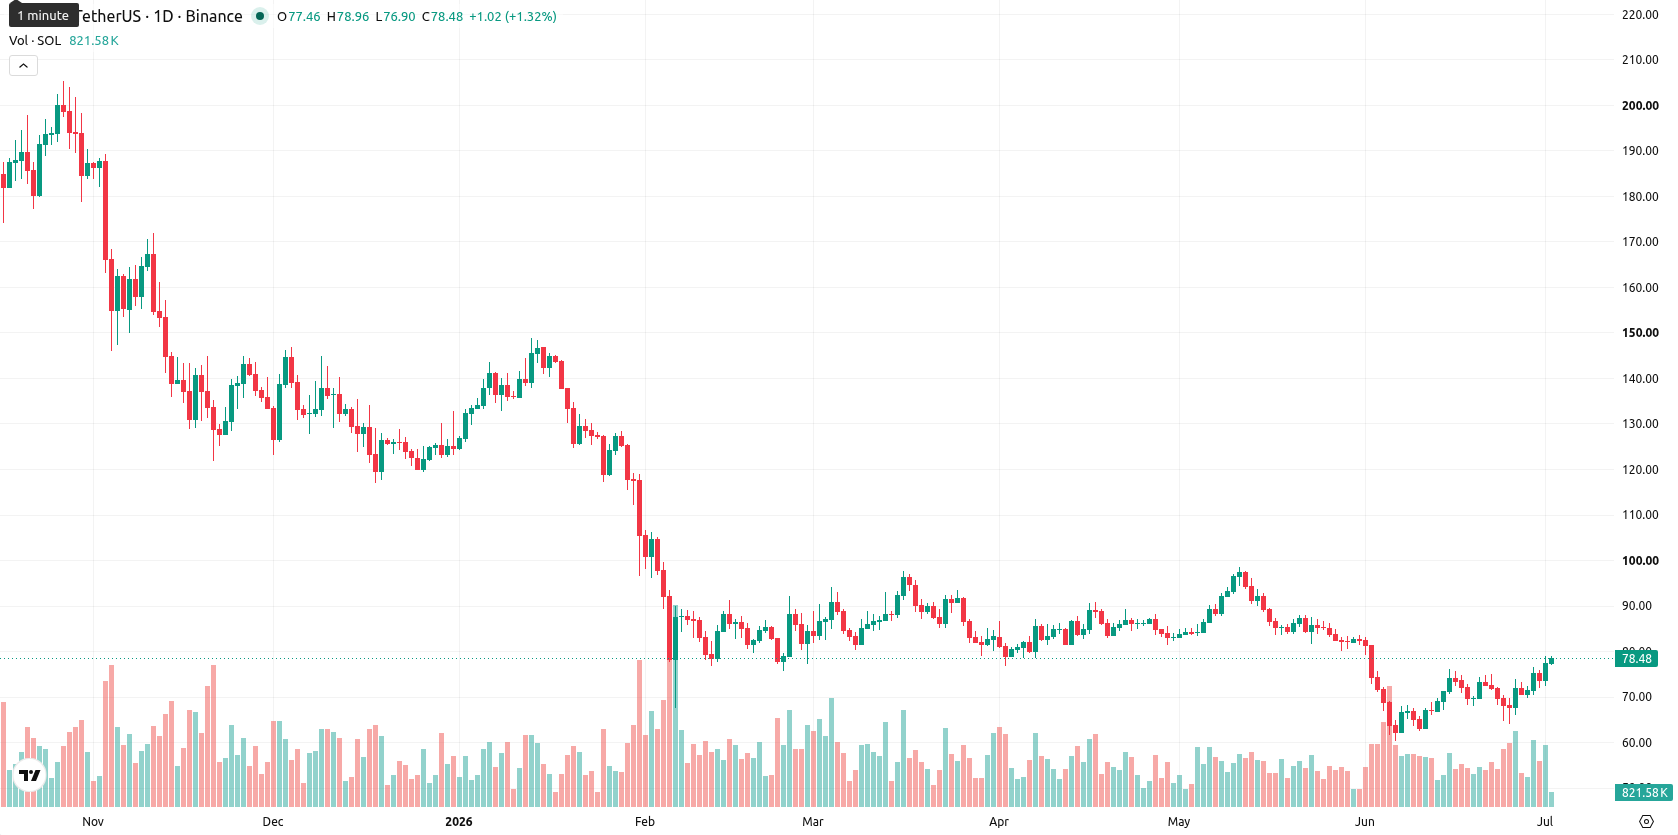
Solana (SOL) is currently trading at $77.80, recording a weekly gain of $10.10 or 14.92% from the previous close of $67.70. Despite the strong move, SOL remains positioned below its weekly MA-20 ($82.14), MA-50 ($132.93), and MA-200 ($106.88), underlining sustained medium- and long-term selling pressure.
Highlights
- Solana trades below key moving averages, reflecting persistent selling pressure and a bearish technical backdrop despite recent gains.
- Short-term recovery drove a 14.92% rally to $77.80, but momentum indicators suggest this move is not supported.
- SOL is expected to trade between $62.30 and $85.30 in the next week, with downside risk outweighing chances of a breakout.
Ecosystem growth and stablecoin flows strengthen network fundamentals this week
Solana dApps generated $257 million in revenue during Q2 2026, leading all Layer 1 and Layer 2 blockchains for the ninth consecutive quarter. Circle increased its USDC issuance on Solana in June 2026 by minting another $1 billion, pushing the yearly total to $64.25 billion and demonstrating robust stablecoin usage on the network. The network has also introduced an onchain governance system, giving validators more influence in decision-making, and saw the launch of the World prediction market platform within the Phantom wallet using Chainlink oracles.
Persistent bearish bias despite rally as weekly momentum stays weak
On the weekly chart, SOL remains below the MA-20, MA-50, and MA-200, with the MA-20 at $82.14 acting as the nearest resistance and dynamic cap on price action. Key weekly support lies at $62.30, while resistance is identified at $85.30. Weekly momentum indicators, including MACD (Strong Sell) and ADX (Sell), still point to lingering bearishness despite the sharp rally, and oscillators such as RSI, Stochastic RSI, and CCI all signal oversold conditions. Bull/Bear Power indicates sellers still have the upper hand, suggesting the rally is not yet supported by a durable shift in sentiment.
Range-bound outlook ahead as bearish momentum signals downside risk
Looking ahead to the next 7 days, the anticipated price corridor is $62.30 to $85.30, reflecting ongoing heightened volatility. With all four major weekly momentum indicators still bearish, the probability of a sustained upside move above resistance is very low (less than 20%). The baseline scenario is sideways consolidation inside this range, unless SOL breaks below $62.30 to trigger a deeper retracement or above $85.30 to spark further short covering. Current technicals point to a period of range-bound action with downside risk prevailing.
Earlier, analysts noted that despite Solana's strong network fundamentals and technical breakouts, broader market weakness continued to limit meaningful upside for SOL. The latest technical and on-chain developments reinforce this view, suggesting traders should closely monitor the $62.30 support for signs of further downside risk amid persistent selling pressure and lack of momentum confirmation.


Latest Solana News


-
 Afghanistan
-
 Albania
-
 Algeria
-
 Angola
-
 Argentina
-
 Armenia
-
 Australia
-
 Austria
-
 Azerbaijan
-
 Bahamas
-
 Bahrain
-
 Bangladesh
-
 Belarus
-
 Belgium
-
 Bolivia
-
 Botswana
-
 Brazil
-
 Brunei
-
 Bulgaria
-
 Cambodia
-
 Cameroon
-
 Canada
-
 Chile
Chile
-
 China
China
-
 Colombia
-
 Congo
Congo
-
 Costa Rica
-
 Cote d'Ivoire
-
 Croatia
-
 Cuba
Cuba
-
 Cyprus
-
 Czechia
-
 DR Congo
-
 Denmark
-
 Dominican Republic
-
 Ecuador
-
 Egypt
Egypt
-
 El Salvador
-
 Estonia
-
 Eswatini
-
 Ethiopia
-
 Finland
-
 France
-
 Georgia
-
 Germany
-
 Ghana
Ghana
-
 Greece
-
 Haiti
Haiti
-
 Hong Kong
-
 Hungary
-
 India
India
-
 Indonesia
-
 Iran, Islamic republic
-
 Iraq
Iraq
-
 Ireland
-
 Israel
-
 Italy
Italy
-
 Jamaica
-
 Japan
Japan
-
 Jordan
-
 Kazakhstan
-
 Kenya
Kenya
-
 Korea
Korea
-
 Kuwait
-
 Kyrgyzstan
-
 Laos
Laos
-
 Latvia
-
 Lebanon
-
 Lesotho
-
 Libya
Libya
-
 Lithuania
-
 Luxembourg
-
 Madagascar
-
 Malaysia
-
 Malta
Malta
-
 Mauritius
-
 Mexico
-
 Moldova
-
 Mongolia
-
 Montenegro
-
 Morocco
-
 Mozambique
-
 Myanmar
-
 Namibia
-
 Nepal
Nepal
-
 Netherlands
-
 New Zealand
-
 Nigeria
-
 North Macedonia
-
 Norway
-
 Oman
Oman
-
 Pakistan
-
 Palestine
-
 Panama
-
 Papua New Guinea
-
 Paraguay
-
 Peru
Peru
-
 Philippines
-
 Poland
-
 Portugal
-
 Puerto Rico
-
 Qatar
Qatar
-
 Reunion
-
 Romania
-
 Rwanda
-
 Saudi Arabia
-
 Serbia
-
 Singapore
-
 Slovakia
-
 Slovenia
-
 Somalia
-
 South Africa
-
 Spain
Spain
-
 Sri Lanka
-
 Sweden
-
 Switzerland
-
 Syria
Syria
-
 Taiwan
-
 Tajikistan
-
 Tanzania
-
 Thailand
-
 Trinidad and Tobago
-
 Tunisia
-
 Turkey
-
 UAE
UAE
-
 Uganda
-
 Ukraine
-
 United Kingdom
-
United States
-
 Uruguay
-
 Uzbekistan
-
 Venezuela
-
 Vietnam
-
 Yemen
Yemen
-
 Zambia
-
 Zimbabwe
- Forex
- Crypto
