
+2.56% for Bitcoin as spot Bitcoin ETF inflows react to weaker US jobs data

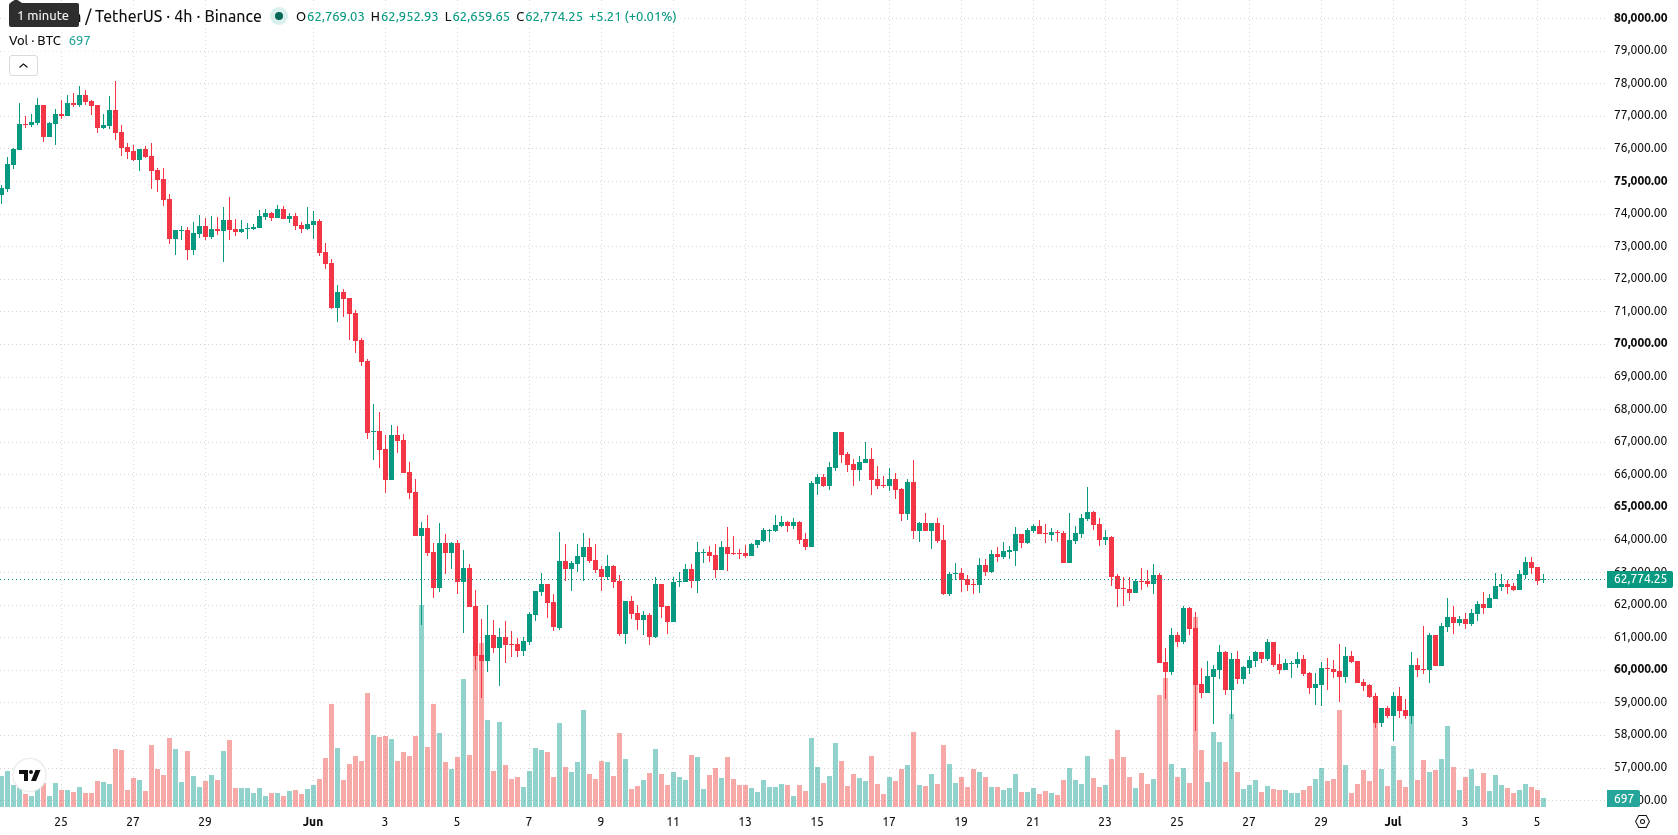
Bitcoin (BTC) is trading at $61,469, up 2.56% on the day. The asset is currently positioned below its key short- and long-term moving averages but sits above intermediate-term averages, reflecting a mix of underlying pressures in different timeframes.
Highlights
- Spot Bitcoin ETFs reversed a 10-day outflow streak with $221.7 million in inflows, signaling revived institutional demand after weaker U.S. jobs data.
- A dormant address linked to the $293 billion Noah Doe lawsuit moved 500 BTC, causing headline uncertainty without immediate price effects.
- BTC/USD faces mixed technical signals, expected to trade mostly sideways between $58,937 and $64,404 with downside favored short-term.
ETF inflows and lawsuit-linked transfer shift institutional sentiment
Spot Bitcoin exchange-traded funds in the U.S. have marked a turnaround by posting $221.7 million in inflows after a 10-day streak of outflows, reflecting renewed institutional demand following weaker jobs data, according to Crypto. This ETF inflow directly increases buying activity and provides a boost to overall market sentiment, as it points to allocator responsiveness to macroeconomic shifts. In a secondary development, 500 BTC was moved from a dormant address tied to the $293B Noah Doe lawsuit, a transfer that introduces headline-driven uncertainty but with less clear short-term price consequences, News Bitcoin reported.
Support levels and indicator divergence highlight unclear momentum
Technically, BTC is trading below the 20-day and 200-day moving averages, while remaining above the 50-day. The Ichimoku Kijun currently provides support at $60,631. On the four-hour chart, the Relative Strength Index (RSI) signals a buy, and the Commodity Channel Index (CCI), Average Directional Index (ADX), and Moving Average Convergence Divergence (MACD) all indicate a bullish bias. However, Bull/Bear Power is overbought, Stochastic RSI is neutral, and the Awesome Oscillator offers no clear trend signal. Price action remains near the lower edge of the daily range with volatility subdued, suggesting technical divergence and mixed sentiment on intraday horizons.
Rangebound trading favored as upside breakout odds stay limited
Over the short term, BTC is projected to trade within a range of $58,937 to $64,404 as typical volatility persists. The probability of a move above the $64,404 resistance is comparatively low at 35%, implying a greater likelihood of downside or rangebound action. For a bullish case, a close above resistance would be required to shift sentiment. Conversely, a sustained break below Kijun support and the range floor could trigger further selling pressure.
Earlier, analysts noted that institutional inflows and renewed accumulation were fostering cautious optimism for Bitcoin despite persistent technical resistance. Continued ETF inflows and shifting market sentiment now reinforce the case for rangebound trading, but investors should closely monitor $60,631 as a key support level given the heightened risk of renewed downside if it breaks.


-
 Afghanistan
-
 Albania
-
 Algeria
-
 Angola
-
 Argentina
-
 Armenia
-
 Australia
-
 Austria
-
 Azerbaijan
-
 Bahamas
-
 Bahrain
-
 Bangladesh
-
 Belarus
-
 Belgium
-
 Bolivia
-
 Botswana
-
 Brazil
-
 Brunei
-
 Bulgaria
-
 Cambodia
-
 Cameroon
-
 Canada
-
 Chile
Chile
-
 China
China
-
 Colombia
-
 Congo
Congo
-
 Costa Rica
-
 Cote d'Ivoire
-
 Croatia
-
 Cuba
Cuba
-
 Cyprus
-
 Czechia
-
 DR Congo
-
 Denmark
-
 Dominican Republic
-
 Ecuador
-
 Egypt
Egypt
-
 El Salvador
-
 Estonia
-
 Eswatini
-
 Ethiopia
-
 Finland
-
 France
-
 Georgia
-
 Germany
-
 Ghana
Ghana
-
 Greece
-
 Haiti
Haiti
-
 Hong Kong
-
 Hungary
-
 India
India
-
 Indonesia
-
 Iran, Islamic republic
-
 Iraq
Iraq
-
 Ireland
-
 Israel
-
 Italy
Italy
-
 Jamaica
-
 Japan
Japan
-
 Jordan
-
 Kazakhstan
-
 Kenya
Kenya
-
 Korea
Korea
-
 Kuwait
-
 Kyrgyzstan
-
 Laos
Laos
-
 Latvia
-
 Lebanon
-
 Lesotho
-
 Libya
Libya
-
 Lithuania
-
 Luxembourg
-
 Madagascar
-
 Malaysia
-
 Malta
Malta
-
 Mauritius
-
 Mexico
-
 Moldova
-
 Mongolia
-
 Montenegro
-
 Morocco
-
 Mozambique
-
 Myanmar
-
 Namibia
-
 Nepal
Nepal
-
 Netherlands
-
 New Zealand
-
 Nigeria
-
 North Macedonia
-
 Norway
-
 Oman
Oman
-
 Pakistan
-
 Palestine
-
 Panama
-
 Papua New Guinea
-
 Paraguay
-
 Peru
Peru
-
 Philippines
-
 Poland
-
 Portugal
-
 Puerto Rico
-
 Qatar
Qatar
-
 Reunion
-
 Romania
-
 Rwanda
-
 Saudi Arabia
-
 Serbia
-
 Singapore
-
 Slovakia
-
 Slovenia
-
 Somalia
-
 South Africa
-
 Spain
Spain
-
 Sri Lanka
-
 Sweden
-
 Switzerland
-
 Syria
Syria
-
 Taiwan
-
 Tajikistan
-
 Tanzania
-
 Thailand
-
 Trinidad and Tobago
-
 Tunisia
-
 Turkey
-
 UAE
UAE
-
 Uganda
-
 Ukraine
-
 United Kingdom
-
United States
-
 Uruguay
-
 Uzbekistan
-
 Venezuela
-
 Vietnam
-
 Yemen
Yemen
-
 Zambia
-
 Zimbabwe
- Forex
- Crypto
