

Dash edges higher amid persistent bearish MACD signal: weekly analysis

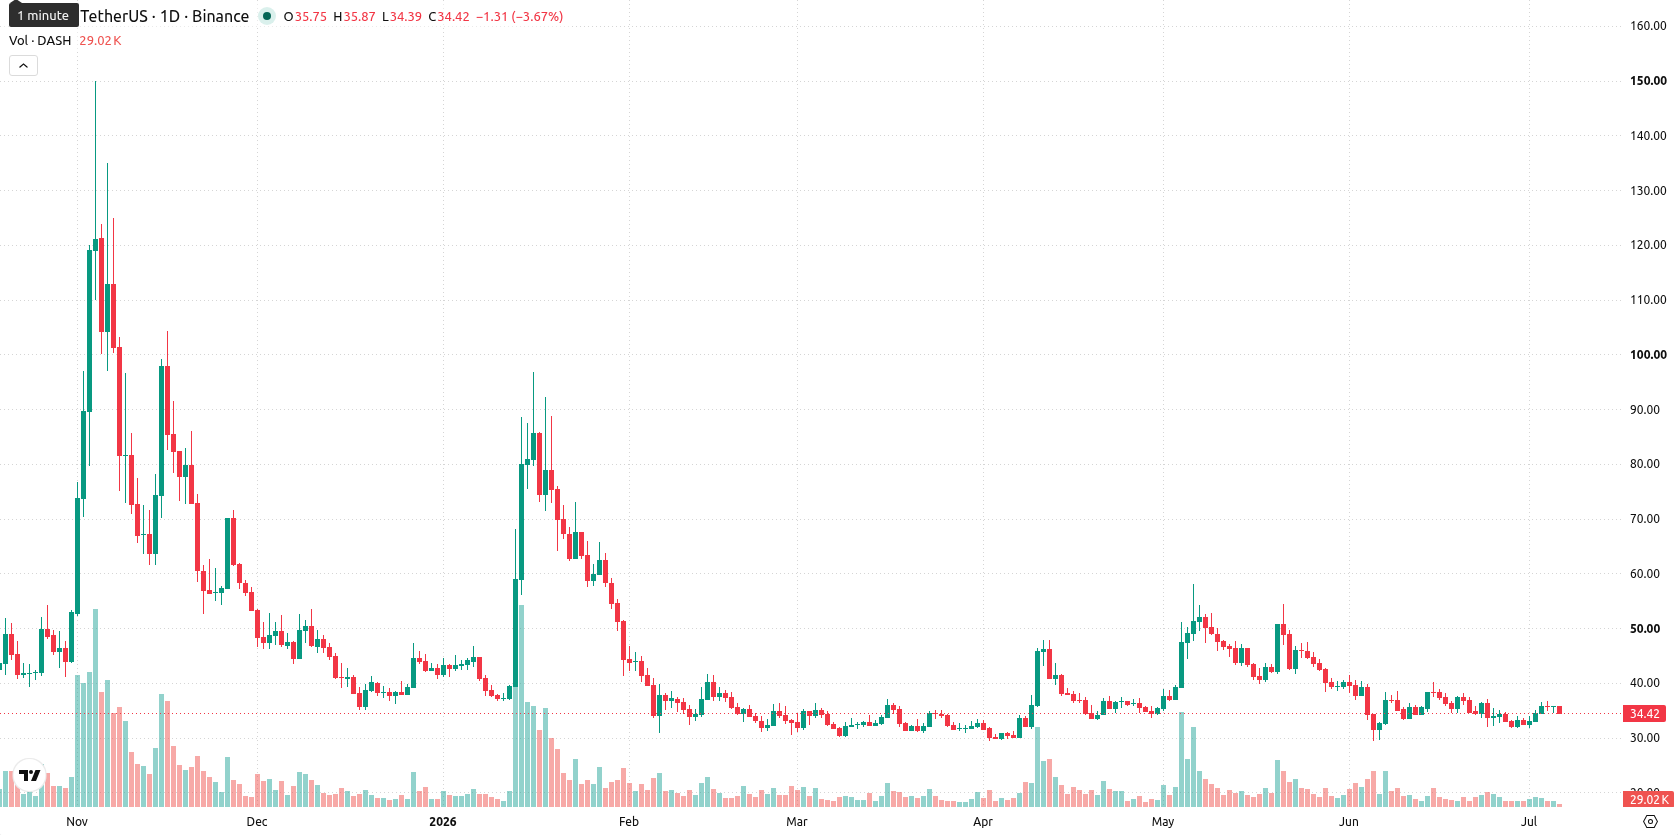
Dash is currently trading at $34.78, showing a gain of $1.62 or 4.95% over the past week. On the weekly chart, Dash remains below both the MA-20 ($36.30) and MA-50 ($40.18), but sits just above the MA-200 ($35.50), indicating continued medium-term pressure while the MA-200 acts as immediate resistance.
 190.74
197.34
190.74
197.34
Highlights
- Dash faces ongoing medium-term selling pressure, trading below major moving averages but above long-term weekly support.
- Momentum signals are mixed, with a bearish MACD, neutral-to-weak RSI and CCI, but Stochastic RSI suggesting a potential oversold bounce.
- Dash is likely to range between $31.50 and $38.50 in the next week, with downside risk prevailing barring a breakout above resistance.
Indecisive weekly momentum as mixed signals cloud direction
Weekly technical analysis highlights a mixed momentum setup for Dash. While price recovered toward the upper end of its 7-day range and remained just above long-term MA-200 support, it continues to face resistance at the MA-20 and MA-50 levels. The weekly MACD remains bearish and Bull/Bear Power is negative at -0.84, reflecting ongoing dominance by sellers. However, the Stochastic RSI issues a strong buy signal despite broadly neutral-to-weak weekly readings in the RSI and CCI, and the persistent trend strength suggested by the ADX (buy) adds to the indecision in the outlook. Identified key weekly support lies at $31.50, with resistance at $38.50.
Sideways bias favored as limited reversal signals guide outlook
Given the current technical landscape, Dash is likely to trade sideways between $31.50 and $38.50 over the next seven days. Only one out of four key momentum indicators signals a potential reversal, which translates to roughly a 25% probability of a bullish breakout, favoring a higher likelihood of consolidation or downside. Sustained movement above $38.50 would be necessary for a bullish scenario toward $40, whereas failure to hold $31.50 could trigger renewed selling down to the $30 area as bearish momentum prevails.
Earlier, analysts noted that Dash had shifted to a more bullish short-term technical outlook, with buyers gaining traction above key moving averages. The current mixed momentum setup introduces additional uncertainty, making sustained movement above the $38.50 resistance a critical signal for the next trend direction.










-
 Afghanistan
-
 Albania
-
 Algeria
-
 Angola
-
 Argentina
-
 Armenia
-
 Australia
-
 Austria
-
 Azerbaijan
-
 Bahamas
-
 Bahrain
-
 Bangladesh
-
 Belarus
-
 Belgium
-
 Bolivia
-
 Botswana
-
 Brazil
-
 Brunei
-
 Bulgaria
-
 Cambodia
-
 Cameroon
-
 Canada
-
 Chile
Chile
-
 China
China
-
 Colombia
-
 Congo
Congo
-
 Costa Rica
-
 Cote d'Ivoire
-
 Croatia
-
 Cuba
Cuba
-
 Cyprus
-
 Czechia
-
 DR Congo
-
 Denmark
-
 Dominican Republic
-
 Ecuador
-
 Egypt
Egypt
-
 El Salvador
-
 Estonia
-
 Eswatini
-
 Ethiopia
-
 Finland
-
 France
-
 Georgia
-
 Germany
-
 Ghana
Ghana
-
 Greece
-
 Haiti
Haiti
-
 Hong Kong
-
 Hungary
-
 India
India
-
 Indonesia
-
 Iran, Islamic republic
-
 Iraq
Iraq
-
 Ireland
-
 Israel
-
 Italy
Italy
-
 Jamaica
-
 Japan
Japan
-
 Jordan
-
 Kazakhstan
-
 Kenya
Kenya
-
 Korea
Korea
-
 Kuwait
-
 Kyrgyzstan
-
 Laos
Laos
-
 Latvia
-
 Lebanon
-
 Lesotho
-
 Libya
Libya
-
 Lithuania
-
 Luxembourg
-
 Madagascar
-
 Malaysia
-
 Malta
Malta
-
 Mauritius
-
 Mexico
-
 Moldova
-
 Mongolia
-
 Montenegro
-
 Morocco
-
 Mozambique
-
 Myanmar
-
 Namibia
-
 Nepal
Nepal
-
 Netherlands
-
 New Zealand
-
 Nigeria
-
 North Macedonia
-
 Norway
-
 Oman
Oman
-
 Pakistan
-
 Palestine
-
 Panama
-
 Papua New Guinea
-
 Paraguay
-
 Peru
Peru
-
 Philippines
-
 Poland
-
 Portugal
-
 Puerto Rico
-
 Qatar
Qatar
-
 Reunion
-
 Romania
-
 Rwanda
-
 Saudi Arabia
-
 Serbia
-
 Singapore
-
 Slovakia
-
 Slovenia
-
 Somalia
-
 South Africa
-
 Spain
Spain
-
 Sri Lanka
-
 Sweden
-
 Switzerland
-
 Syria
Syria
-
 Taiwan
-
 Tajikistan
-
 Tanzania
-
 Thailand
-
 Trinidad and Tobago
-
 Tunisia
-
 Turkey
-
 UAE
UAE
-
 Uganda
-
 Ukraine
-
 United Kingdom
-
United States
-
 Uruguay
-
 Uzbekistan
-
 Venezuela
-
 Vietnam
-
 Yemen
Yemen
-
 Zambia
-
 Zimbabwe
- Forex
- Crypto












