
Celestia faces downside risk as RSI signals sell territory: weekly review

Celestia (TIA) is currently trading above its weekly MA-20 at $0.3543, while remaining well below the MA-50 positioned at $0.7288. Over the past week, the asset has declined by $0.0116, representing a 3.10% drop, and price action is centered within the weekly range, indicating heightened volatility and ongoing medium- to long-term selling pressure.
 0.3934
0.4140
0.3934
0.4140
Highlights
- TIA is consolidating above its short-term moving average but faces ongoing medium- and long-term selling pressure.
- Technical indicators remain strongly bearish, with momentum fading and no key signals suggesting imminent recovery.
- TIA is likely to trade between $0.345 and $0.410 this week, with high volatility and a downside bias prevailing.
Support focus grows as network developments and updates stabilize sentiment
Recent developments confirm that the Celestia network continues to focus on enabling efficient data availability for rollups, a foundational aspect of its modular Layer 1 blockchain protocol. Market participants are closely monitoring technical support, particularly in the $0.29–$0.30 region, as it remains crucial for maintaining TIA’s structural integrity. No additional regulatory or ecosystem updates have been reported.
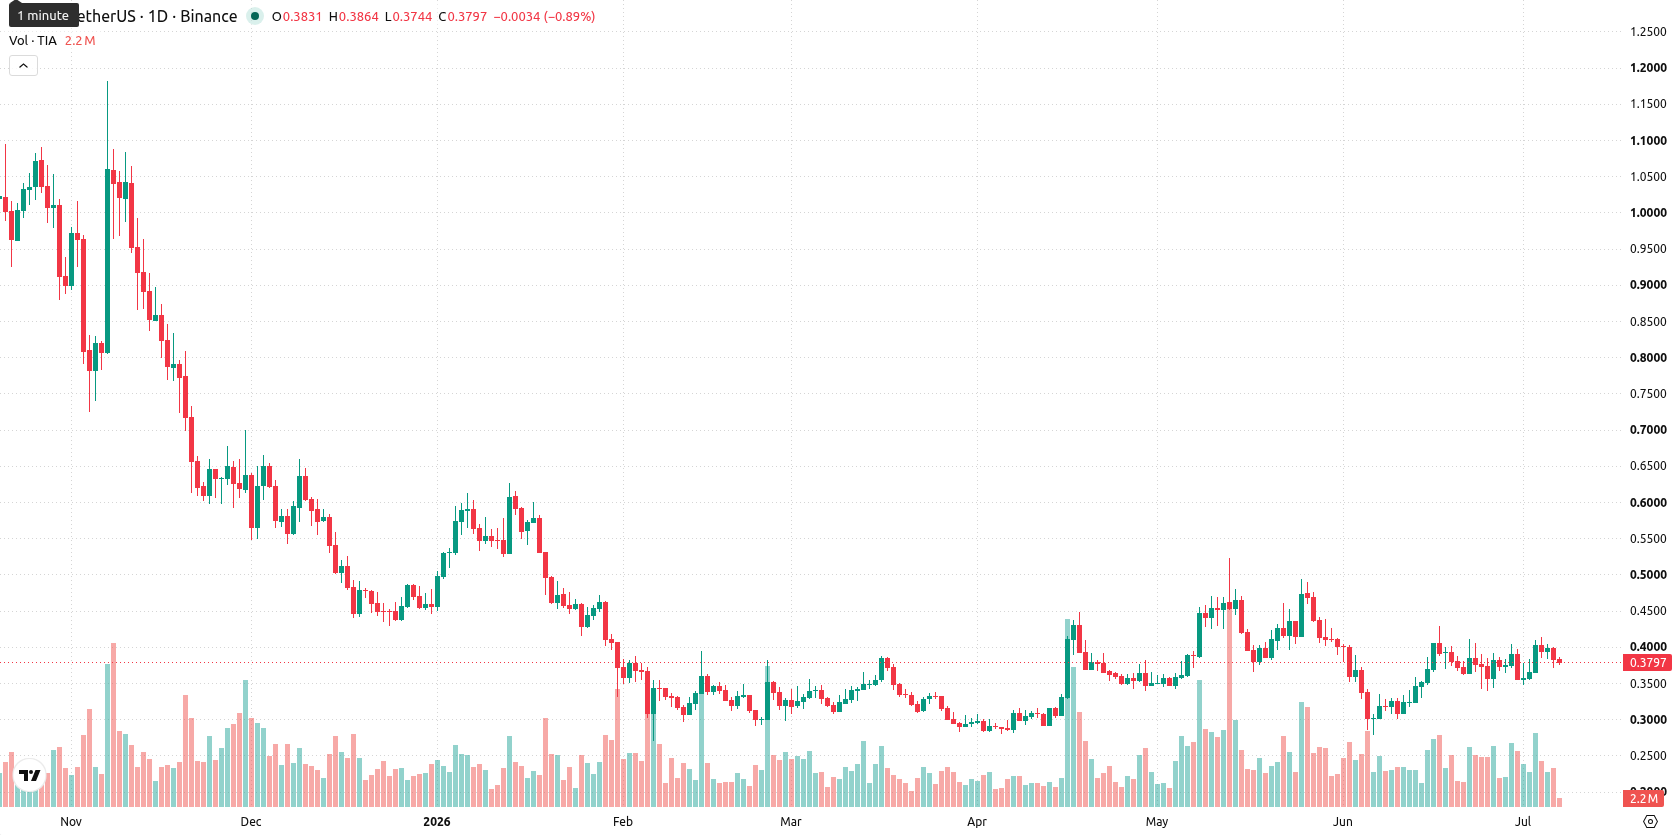
Bearish technical signals deepen as weekly momentum and oscillators diverge
Weekly technical analysis highlights sustained bearish momentum, with TIA trading firmly above its MA-20 support at $0.3543 but remaining under pressure from the MA-50 at $0.7288. The weekly MACD signals strong selling, and the Average Directional Index points to continued downside. Oscillator readings conflict, as the RSI is in sell territory, Stochastic RSI is strongly overbought, and the CCI is neutral, suggesting momentum is deteriorating and that the asset may be vulnerable to further cooling. Bull/Bear Power reflects marginal buying, but the overall tone is bearish, confirmed by a significant weekly price drop and elevated volatility at 19.41%.
Consolidation likely with breakout risk minimal in coming week
For the next 7 days, TIA is expected to consolidate between $0.345 and $0.410, in line with recent weekly volatility. The probability of a breakout to the upside is very low, less than 20%, as none of the four key weekly indicators currently flash a buy signal. Should price overcome $0.410, a short-term move towards $0.42 could play out, while further decline below $0.345 would expose TIA to additional downside risk and new weekly lows.
Earlier, analysts noted that Celestia was exhibiting a shift toward bullish momentum as buyers regained control amid improving fundamentals. However, the current environment signals a decisive turn, with sustained bearish pressure now prevailing and any move below the $0.345 level likely to trigger a new phase of downside risk for TIA.














-
 Afghanistan
-
 Albania
-
 Algeria
-
 Angola
-
 Argentina
-
 Armenia
-
 Australia
-
 Austria
-
 Azerbaijan
-
 Bahamas
-
 Bahrain
-
 Bangladesh
-
 Belarus
-
 Belgium
-
 Bolivia
-
 Botswana
-
 Brazil
-
 Brunei
-
 Bulgaria
-
 Cambodia
-
 Cameroon
-
 Canada
-
 Chile
Chile
-
 China
China
-
 Colombia
-
 Congo
Congo
-
 Costa Rica
-
 Cote d'Ivoire
-
 Croatia
-
 Cuba
Cuba
-
 Cyprus
-
 Czechia
-
 DR Congo
-
 Denmark
-
 Dominican Republic
-
 Ecuador
-
 Egypt
Egypt
-
 El Salvador
-
 Estonia
-
 Eswatini
-
 Ethiopia
-
 Finland
-
 France
-
 Georgia
-
 Germany
-
 Ghana
Ghana
-
 Greece
-
 Haiti
Haiti
-
 Hong Kong
-
 Hungary
-
 India
India
-
 Indonesia
-
 Iran, Islamic republic
-
 Iraq
Iraq
-
 Ireland
-
 Israel
-
 Italy
Italy
-
 Jamaica
-
 Japan
Japan
-
 Jordan
-
 Kazakhstan
-
 Kenya
Kenya
-
 Korea
Korea
-
 Kuwait
-
 Kyrgyzstan
-
 Laos
Laos
-
 Latvia
-
 Lebanon
-
 Lesotho
-
 Libya
Libya
-
 Lithuania
-
 Luxembourg
-
 Madagascar
-
 Malaysia
-
 Malta
Malta
-
 Mauritius
-
 Mexico
-
 Moldova
-
 Mongolia
-
 Montenegro
-
 Morocco
-
 Mozambique
-
 Myanmar
-
 Namibia
-
 Nepal
Nepal
-
 Netherlands
-
 New Zealand
-
 Nigeria
-
 North Macedonia
-
 Norway
-
 Oman
Oman
-
 Pakistan
-
 Palestine
-
 Panama
-
 Papua New Guinea
-
 Paraguay
-
 Peru
Peru
-
 Philippines
-
 Poland
-
 Portugal
-
 Puerto Rico
-
 Qatar
Qatar
-
 Reunion
-
 Romania
-
 Rwanda
-
 Saudi Arabia
-
 Serbia
-
 Singapore
-
 Slovakia
-
 Slovenia
-
 Somalia
-
 South Africa
-
 Spain
Spain
-
 Sri Lanka
-
 Sweden
-
 Switzerland
-
 Syria
Syria
-
 Taiwan
-
 Tajikistan
-
 Tanzania
-
 Thailand
-
 Trinidad and Tobago
-
 Tunisia
-
 Turkey
-
 UAE
UAE
-
 Uganda
-
 Ukraine
-
 United Kingdom
-
United States
-
 Uruguay
-
 Uzbekistan
-
 Venezuela
-
 Vietnam
-
 Yemen
Yemen
-
 Zambia
-
 Zimbabwe
- Forex
- Crypto











