
Ethereum stays under pressure as $1,706 support level comes into focus

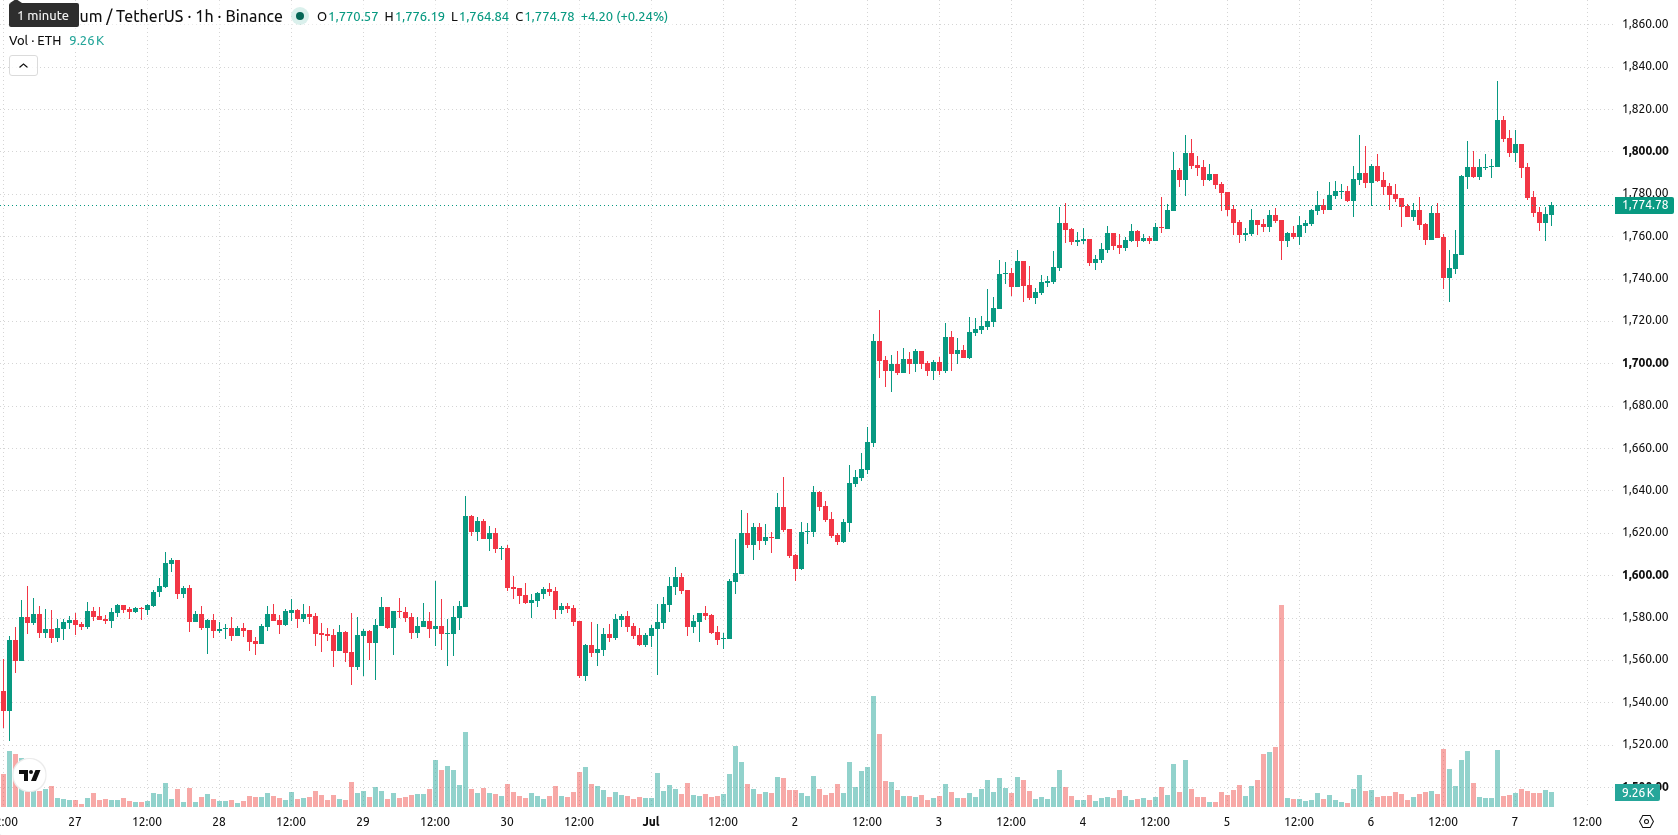
Ethereum (ETH) is trading at $1,768.74, posting a modest decline on the day. The price remains positioned below its key moving averages, reflecting ongoing near-term pressure.
 1785
1833.40
1785
1833.40
Highlights
- U.S. spot Ethereum ETFs saw a net inflow of $20.7 million on July 6, reflecting ongoing institutional interest.
- BlackRock's iShares Ethereum Trust led with $23.3 million in new capital, marking a strong commitment by key asset managers.
- ETH/USD trades below critical moving averages with momentum mixed, and is expected to range between $1,706 and $1,831, with a slight downside bias.
BlackRock-led inflows bolster institutional demand for spot ethereum ETFs
U.S. spot Ethereum ETFs posted a net inflow of $20.7 million on July 6, as reported by Bitcoinworld Co, highlighting continued institutional allocations into the asset class. BlackRock's iShares Ethereum Trust (ETHA) led activity with $23.3 million in new capital, indicating a notable commitment by major asset managers to Ethereum-based investment products. Earlier in the same week, data from Odaily showed that spot Ethereum ETFs experienced $29.1 million in net inflows on July 2, underscoring sustained investor interest from the institutional segment.
Oversold signals mount as ETH hovers below major technical barriers
On the technical front, ETH/USD remains below both the MA-20 at $1,780 and MA-50 at $1,776 on the hourly chart, and is trading notably beneath the daily MA-200 at $2,259. The immediate resistance level is marked by the Ichimoku Kijun at $1,781, while short-term support emerges at $1,706. Indicator readings are mixed: the Moving Average Convergence Divergence (MACD) and Average Directional Index (ADX) are neutral on the hourly timeframe, while the Relative Strength Index (RSI) stands at 44.15 and the Commodity Channel Index (CCI) point to intraday bearish pressure. Stochastic RSI and Bull/Bear Power both indicate oversold conditions, and the Awesome Oscillator signals a strong sell bias, reinforcing a generally cautious technical landscape.
Downside tilt persists as price consolidates within volatility band
In the short term, Ethereum is expected to trade within a typical volatility band between $1,706 and $1,831 over the next two to three days. Probabilities are tilted marginally to the downside, with a 52% likelihood of a lower move versus 48% for an upside break. The baseline scenario anticipates range-bound price action within this corridor. A decisive move above $1,781 could open the way toward $1,831, while a close below $1,706 would likely trigger a retest of lower support levels.
Previously it was reported that Bitmine Immersion Technologies increased its Ether holdings as part of a growing trend of institutional treasury strategies targeting Ethereum. The recent inflows into U.S. spot Ethereum ETFs, despite short-term price consolidation, suggest sustained institutional interest could provide a supportive backdrop, making Ethereum's response to near-term resistance and potential breakout above $1,781 a crucial dynamic to monitor.





Latest Ethereum News









-
 Afghanistan
-
 Albania
-
 Algeria
-
 Angola
-
 Argentina
-
 Armenia
-
 Australia
-
 Austria
-
 Azerbaijan
-
 Bahamas
-
 Bahrain
-
 Bangladesh
-
 Belarus
-
 Belgium
-
 Bolivia
-
 Botswana
-
 Brazil
-
 Brunei
-
 Bulgaria
-
 Cambodia
-
 Cameroon
-
 Canada
-
 Chile
Chile
-
 China
China
-
 Colombia
-
 Congo
Congo
-
 Costa Rica
-
 Cote d'Ivoire
-
 Croatia
-
 Cuba
Cuba
-
 Cyprus
-
 Czechia
-
 DR Congo
-
 Denmark
-
 Dominican Republic
-
 Ecuador
-
 Egypt
Egypt
-
 El Salvador
-
 Estonia
-
 Eswatini
-
 Ethiopia
-
 Finland
-
 France
-
 Georgia
-
 Germany
-
 Ghana
Ghana
-
 Greece
-
 Haiti
Haiti
-
 Hong Kong
-
 Hungary
-
 India
India
-
 Indonesia
-
 Iran, Islamic republic
-
 Iraq
Iraq
-
 Ireland
-
 Israel
-
 Italy
Italy
-
 Jamaica
-
 Japan
Japan
-
 Jordan
-
 Kazakhstan
-
 Kenya
Kenya
-
 Korea
Korea
-
 Kuwait
-
 Kyrgyzstan
-
 Laos
Laos
-
 Latvia
-
 Lebanon
-
 Lesotho
-
 Libya
Libya
-
 Lithuania
-
 Luxembourg
-
 Madagascar
-
 Malaysia
-
 Malta
Malta
-
 Mauritius
-
 Mexico
-
 Moldova
-
 Mongolia
-
 Montenegro
-
 Morocco
-
 Mozambique
-
 Myanmar
-
 Namibia
-
 Nepal
Nepal
-
 Netherlands
-
 New Zealand
-
 Nigeria
-
 North Macedonia
-
 Norway
-
 Oman
Oman
-
 Pakistan
-
 Palestine
-
 Panama
-
 Papua New Guinea
-
 Paraguay
-
 Peru
Peru
-
 Philippines
-
 Poland
-
 Portugal
-
 Puerto Rico
-
 Qatar
Qatar
-
 Reunion
-
 Romania
-
 Rwanda
-
 Saudi Arabia
-
 Serbia
-
 Singapore
-
 Slovakia
-
 Slovenia
-
 Somalia
-
 South Africa
-
 Spain
Spain
-
 Sri Lanka
-
 Sweden
-
 Switzerland
-
 Syria
Syria
-
 Taiwan
-
 Tajikistan
-
 Tanzania
-
 Thailand
-
 Trinidad and Tobago
-
 Tunisia
-
 Turkey
-
 UAE
UAE
-
 Uganda
-
 Ukraine
-
 United Kingdom
-
United States
-
 Uruguay
-
 Uzbekistan
-
 Venezuela
-
 Vietnam
-
 Yemen
Yemen
-
 Zambia
-
 Zimbabwe
- Forex
- Crypto











