
Solana holds gains as blockchain usage and spot volume reach new records

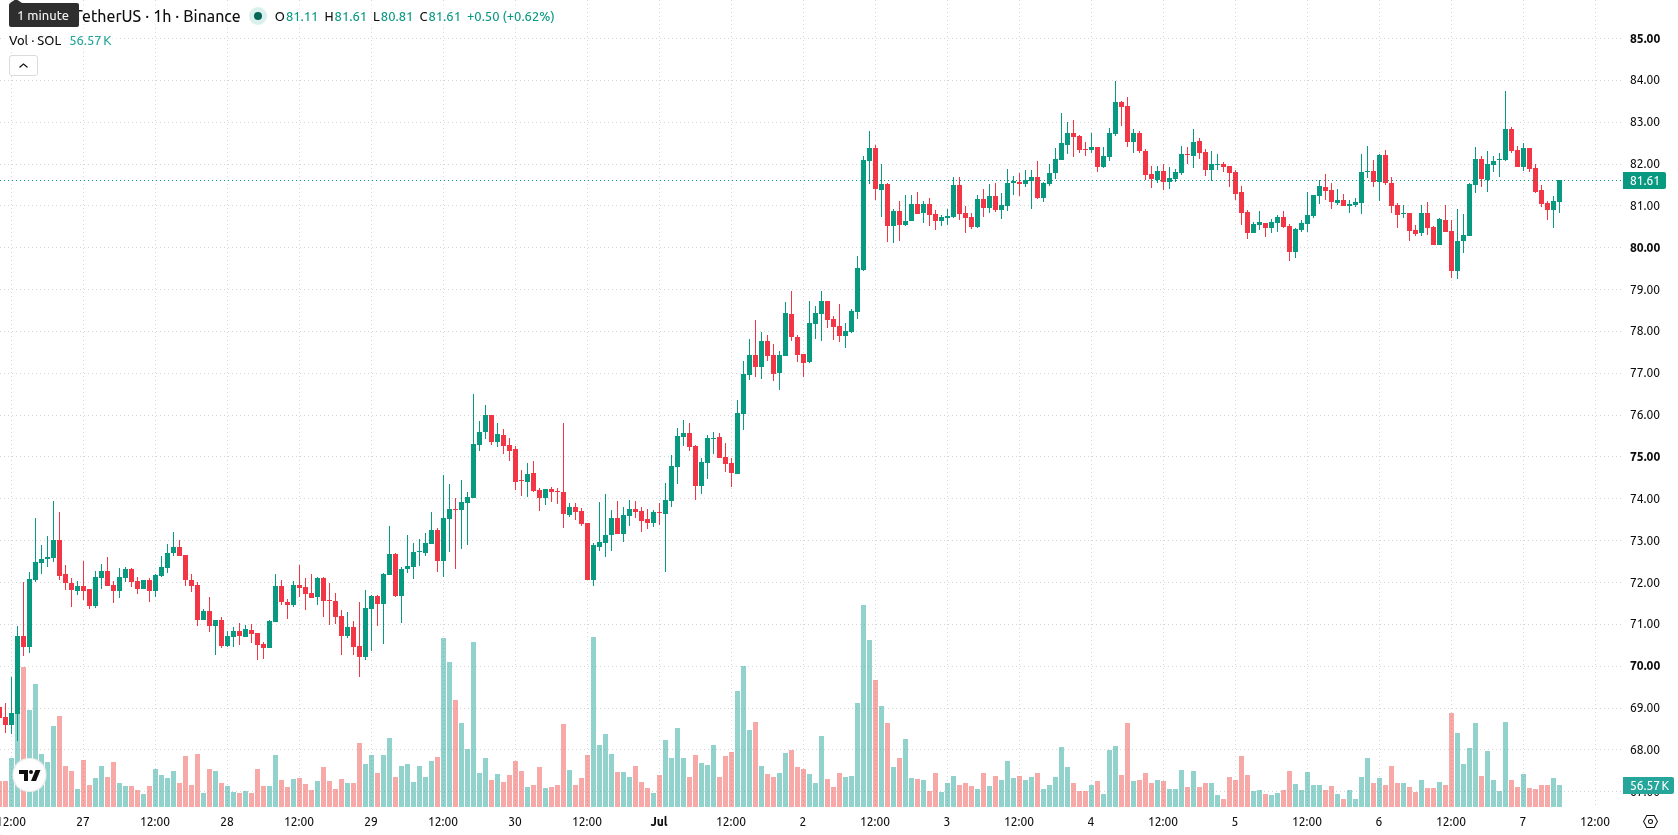
Solana (SOL) is trading at $81.01, posting a modest gain on the day. The asset remains below its key moving averages, indicating ongoing technical pressure.
 80.78
83.98
80.78
83.98
Highlights
- Solana achieved a milestone with 900 million non-vote weekly transactions in July 2026, underscoring surging network utilization and scalability.
- Tokenized asset spot volume hit a record $5.77 billion in Q2 2026, driven by increased institutional adoption and Solana’s growth in tokenized equities.
- SOL/USD faces a bearish short-term trend, consolidating between $78.39 and $84.06, with momentum signals mixed and downside risk slightly favored.
Record transaction throughput and institutional volume boost Solana’s standing
Solana processed a record 900 million non-vote weekly transactions in early July 2026, highlighting surging network activity and showcasing the platform’s ability to accommodate high throughput, according to Tronweekly. This milestone reflects robust demand for Solana’s infrastructure, supporting ongoing utility and reinforcing its standing among blockchain networks. Complementing this, Q2 2026 saw tokenized asset spot volume reach an all-time high of $5.77 billion, pointing to deepening institutional participation and Solana’s leadership in tokenized equities and real-world assets, as per Finance Yahoo. Further, the introduction of a new protocol governance framework in early July 2026 has enhanced decision-making transparency and bolstered long-term decentralization, as reported by Coininsider.
Mixed momentum signals amid resistance at key moving averages
SOL/USD is trading below the MA-20 ($81.40) and MA-50 ($81.12) on the hourly chart, with the long-term MA-200 at $93.20 acting as a higher resistance level. The Ichimoku Kijun sits at $81.49, setting immediate resistance overhead. On the momentum front, the Moving Average Convergence Divergence (MACD) signals strong buy momentum, while the Relative Strength Index (RSI) at 46.09 and the Commodity Channel Index (CCI) point to a sell bias. Both the Stochastic RSI and Bull/Bear Power indicate oversold conditions, suggesting current seller dominance. The Average Directional Index (ADX) remains neutral, and the Awesome Oscillator does not show additional momentum confirmation. Divergence across these indicators points to an uncertain intraday tone, with mixed cues between strong MACD momentum and persistent oversold oscillator signals.
Sideways price action likely as range-bound outlook meets technical conflict
In the short term, SOL/USD is expected to consolidate within a projected range of $78.39 to $84.06 over the next two to three trading days. A move above immediate resistance at $81.49 could open the way toward the upper end of this volatility band, while further weakness below $78.39 would signal increased downside risk. The most likely scenario is continued sideways price action, as market participants weigh conflicting technical signals and recent fundamental developments.
Earlier, analysts noted that Solana's recovery prospects would depend on both strong on-chain fundamentals and an improvement in broader market liquidity. The latest surge in network activity, institutional adoption, and governance enhancements now adds fundamental support to the outlook, but with intraday indicators presenting mixed signals, the prevailing scenario is continued range-bound price action in the immediate term.













-
 Afghanistan
-
 Albania
-
 Algeria
-
 Angola
-
 Argentina
-
 Armenia
-
 Australia
-
 Austria
-
 Azerbaijan
-
 Bahamas
-
 Bahrain
-
 Bangladesh
-
 Belarus
-
 Belgium
-
 Bolivia
-
 Botswana
-
 Brazil
-
 Brunei
-
 Bulgaria
-
 Cambodia
-
 Cameroon
-
 Canada
-
 Chile
Chile
-
 China
China
-
 Colombia
-
 Congo
Congo
-
 Costa Rica
-
 Cote d'Ivoire
-
 Croatia
-
 Cuba
Cuba
-
 Cyprus
-
 Czechia
-
 DR Congo
-
 Denmark
-
 Dominican Republic
-
 Ecuador
-
 Egypt
Egypt
-
 El Salvador
-
 Estonia
-
 Eswatini
-
 Ethiopia
-
 Finland
-
 France
-
 Georgia
-
 Germany
-
 Ghana
Ghana
-
 Greece
-
 Haiti
Haiti
-
 Hong Kong
-
 Hungary
-
 India
India
-
 Indonesia
-
 Iran, Islamic republic
-
 Iraq
Iraq
-
 Ireland
-
 Israel
-
 Italy
Italy
-
 Jamaica
-
 Japan
Japan
-
 Jordan
-
 Kazakhstan
-
 Kenya
Kenya
-
 Korea
Korea
-
 Kuwait
-
 Kyrgyzstan
-
 Laos
Laos
-
 Latvia
-
 Lebanon
-
 Lesotho
-
 Libya
Libya
-
 Lithuania
-
 Luxembourg
-
 Madagascar
-
 Malaysia
-
 Malta
Malta
-
 Mauritius
-
 Mexico
-
 Moldova
-
 Mongolia
-
 Montenegro
-
 Morocco
-
 Mozambique
-
 Myanmar
-
 Namibia
-
 Nepal
Nepal
-
 Netherlands
-
 New Zealand
-
 Nigeria
-
 North Macedonia
-
 Norway
-
 Oman
Oman
-
 Pakistan
-
 Palestine
-
 Panama
-
 Papua New Guinea
-
 Paraguay
-
 Peru
Peru
-
 Philippines
-
 Poland
-
 Portugal
-
 Puerto Rico
-
 Qatar
Qatar
-
 Reunion
-
 Romania
-
 Rwanda
-
 Saudi Arabia
-
 Serbia
-
 Singapore
-
 Slovakia
-
 Slovenia
-
 Somalia
-
 South Africa
-
 Spain
Spain
-
 Sri Lanka
-
 Sweden
-
 Switzerland
-
 Syria
Syria
-
 Taiwan
-
 Tajikistan
-
 Tanzania
-
 Thailand
-
 Trinidad and Tobago
-
 Tunisia
-
 Turkey
-
 UAE
UAE
-
 Uganda
-
 Ukraine
-
 United Kingdom
-
United States
-
 Uruguay
-
 Uzbekistan
-
 Venezuela
-
 Vietnam
-
 Yemen
Yemen
-
 Zambia
-
 Zimbabwe
- Forex
- Crypto











