

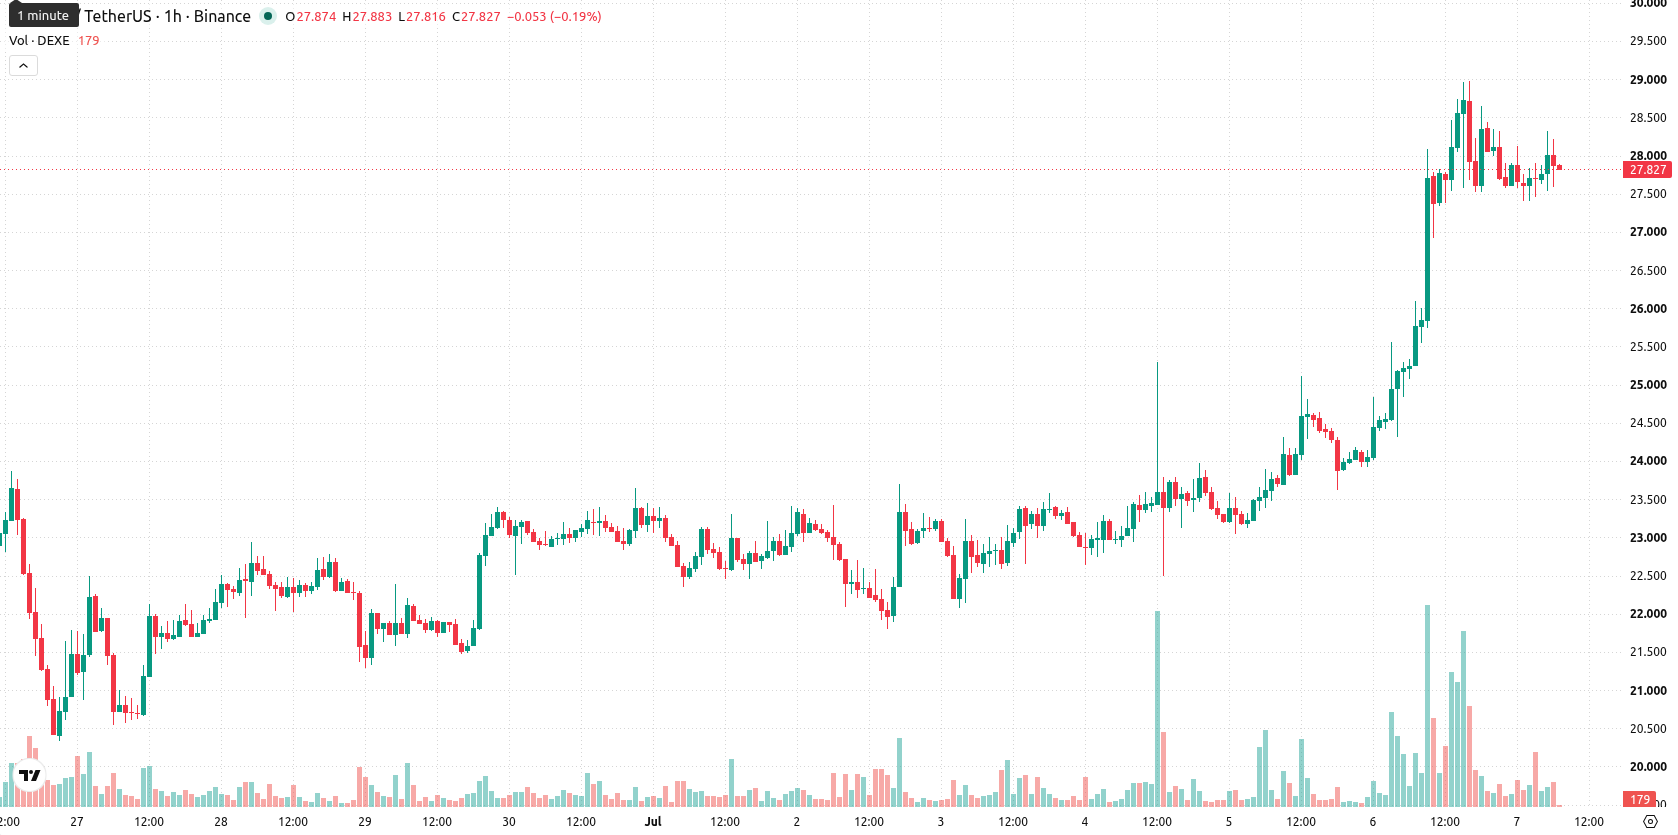
DeXe (DEXE) is trading at $27.71, marking a daily move up of 9.7%. The asset trades below its key short-term moving averages, but remains supported on medium and long-term trends.
 28.6
29.35
28.6
29.35
Highlights
- DeXe surged above a pivotal resistance on July 6, 2026, as low exchange liquidity amplified price movement from limited new inflows.
- A thin order book created a pronounced supply-demand imbalance, with modest buying producing outsized spot price shifts.
- Technical outlook is range-bound between $26.1 and $29.32, with mixed momentum signals and intraday volatility suggesting near-term consolidation despite a strong recent gain.
Supply-demand imbalance as low liquidity magnifies resistance breakout
DeXe broke above a key technical resistance level on July 6, 2026, an event underscored by limited exchange liquidity that amplified the market response, according to Cryptonews. This triggered a supply-demand imbalance, where modest inflows of investor activity produced a pronounced effect on price action. The episode illustrates how constrained market depth can magnify reactions to even routine interest shifts, with new demand leading to increased spot buying pressure.
Mixed momentum and volatility as technical signals diverge
Looking at technical levels, DEXE/USD sits below the MA-20 at $27.88, but above the MA-50 at $25.84 and the MA-200 at $9.3. Immediate support lies at the Ichimoku Kijun, calculated at $26.65. On the hourly timeframe, the Moving Average Convergence Divergence (MACD) indicates strong buy momentum, and the Average Directional Index (ADX) shows a buy bias. However, indicator signals remain mixed — the Relative Strength Index (RSI) sits in buy territory, the Stochastic RSI is oversold, Commodity Channel Index (CCI) issues a sell, Bull/Bear Power (BBP) reflects strong buyer dominance, and the Awesome Oscillator is neutral. Elevated volatility and a close near daily lows suggest continued intraday uncertainty despite recent gains.
Sideways trade expected as volatility shapes breakout risks
In the near term, DEXE/USD is expected to consolidate within a range of $26.1 to $29.32, reflecting typical volatility around current levels. The dominant scenario foresees sideways movement, with a breakout above $29.32 signifying renewed bullish momentum. Conversely, a decisive break below support at $26.65 could expose the lower band near $26.1 and caution short-term traders.
Earlier, analysts noted that DeXe's uptrend was driven by strong technical momentum and elevated investor interest. Fresh volatility signals and mixed indicators in the current session add complexity to the outlook, making a sustained move above $29.32 or a drop below $26.65 critical inflection points for near-term traders.





Latest DeXe News









-
 Afghanistan
-
 Albania
-
 Algeria
-
 Angola
-
 Argentina
-
 Armenia
-
 Australia
-
 Austria
-
 Azerbaijan
-
 Bahamas
-
 Bahrain
-
 Bangladesh
-
 Belarus
-
 Belgium
-
 Bolivia
-
 Botswana
-
 Brazil
-
 Brunei
-
 Bulgaria
-
 Cambodia
-
 Cameroon
-
 Canada
-
 Chile
Chile
-
 China
China
-
 Colombia
-
 Congo
Congo
-
 Costa Rica
-
 Cote d'Ivoire
-
 Croatia
-
 Cuba
Cuba
-
 Cyprus
-
 Czechia
-
 DR Congo
-
 Denmark
-
 Dominican Republic
-
 Ecuador
-
 Egypt
Egypt
-
 El Salvador
-
 Estonia
-
 Eswatini
-
 Ethiopia
-
 Finland
-
 France
-
 Georgia
-
 Germany
-
 Ghana
Ghana
-
 Greece
-
 Haiti
Haiti
-
 Hong Kong
-
 Hungary
-
 India
India
-
 Indonesia
-
 Iran, Islamic republic
-
 Iraq
Iraq
-
 Ireland
-
 Israel
-
 Italy
Italy
-
 Jamaica
-
 Japan
Japan
-
 Jordan
-
 Kazakhstan
-
 Kenya
Kenya
-
 Korea
Korea
-
 Kuwait
-
 Kyrgyzstan
-
 Laos
Laos
-
 Latvia
-
 Lebanon
-
 Lesotho
-
 Libya
Libya
-
 Lithuania
-
 Luxembourg
-
 Madagascar
-
 Malaysia
-
 Malta
Malta
-
 Mauritius
-
 Mexico
-
 Moldova
-
 Mongolia
-
 Montenegro
-
 Morocco
-
 Mozambique
-
 Myanmar
-
 Namibia
-
 Nepal
Nepal
-
 Netherlands
-
 New Zealand
-
 Nigeria
-
 North Macedonia
-
 Norway
-
 Oman
Oman
-
 Pakistan
-
 Palestine
-
 Panama
-
 Papua New Guinea
-
 Paraguay
-
 Peru
Peru
-
 Philippines
-
 Poland
-
 Portugal
-
 Puerto Rico
-
 Qatar
Qatar
-
 Reunion
-
 Romania
-
 Rwanda
-
 Saudi Arabia
-
 Serbia
-
 Singapore
-
 Slovakia
-
 Slovenia
-
 Somalia
-
 South Africa
-
 Spain
Spain
-
 Sri Lanka
-
 Sweden
-
 Switzerland
-
 Syria
Syria
-
 Taiwan
-
 Tajikistan
-
 Tanzania
-
 Thailand
-
 Trinidad and Tobago
-
 Tunisia
-
 Turkey
-
 UAE
UAE
-
 Uganda
-
 Ukraine
-
 United Kingdom
-
United States
-
 Uruguay
-
 Uzbekistan
-
 Venezuela
-
 Vietnam
-
 Yemen
Yemen
-
 Zambia
-
 Zimbabwe
- Forex
- Crypto











