

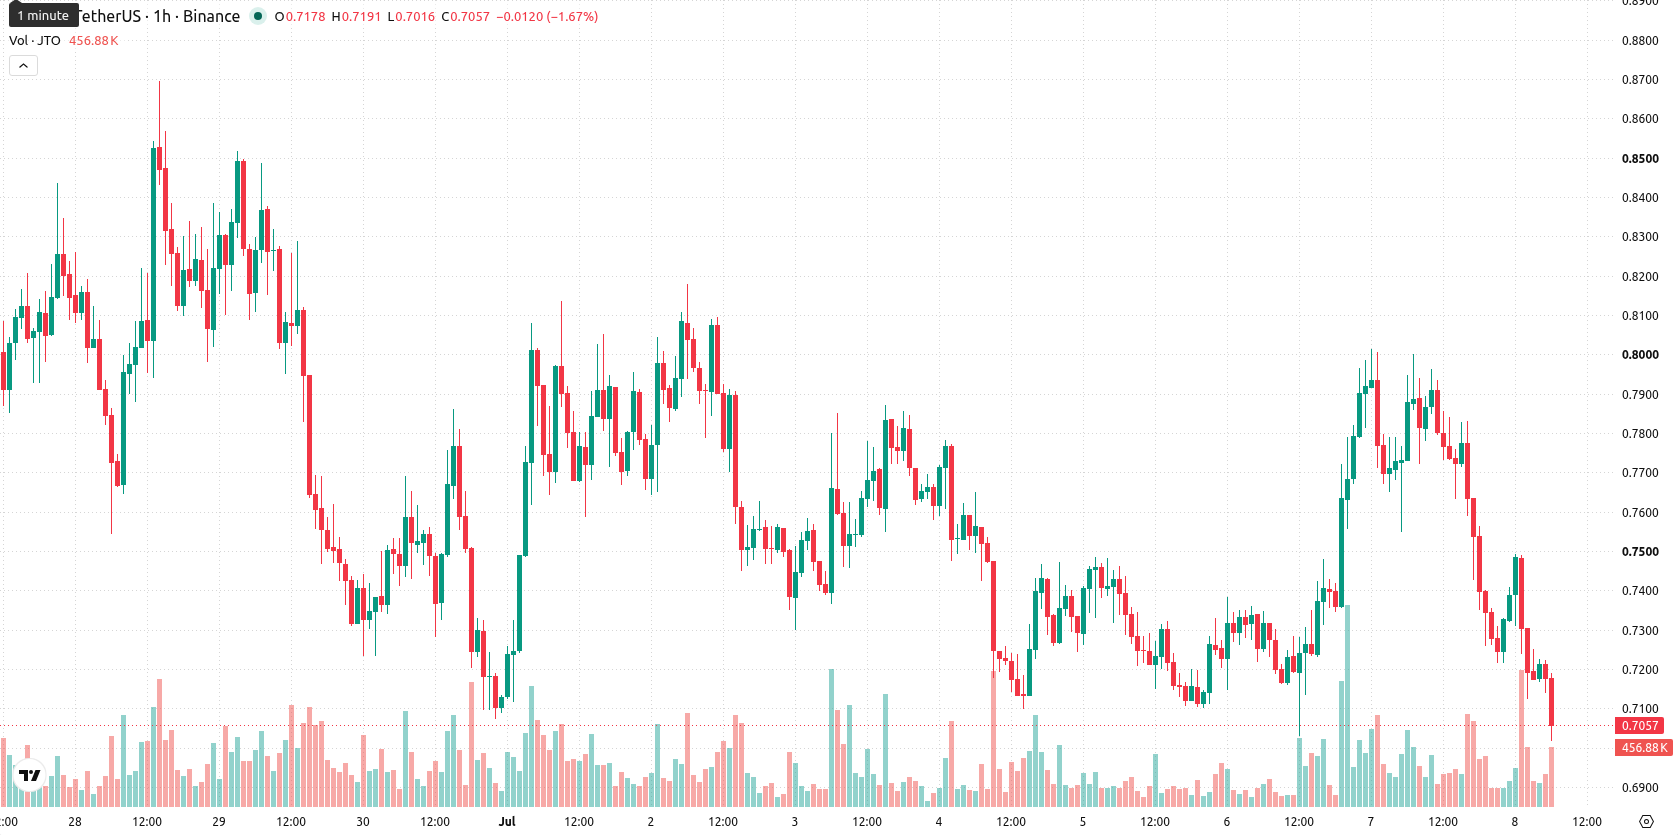
Jito (JTO) is trading at $0.7048, reflecting a daily drop of 10.76% and currently sitting below its key short-term moving averages. The asset has experienced strong downside movement during the latest session.
 0.7492
0.8180
0.7492
0.8180
Highlights
- JTO/USD remains under pronounced bearish momentum, with prices trading below key short- and medium-term moving averages.
- Momentum indicators, including MACD and RSI, confirm strong selling pressure, with uptrend probability significantly reduced in the near term.
- Price is expected to fluctuate between $0.6791 and $0.7407 over the next several sessions, with downside breakout risks prevailing.
Bearish momentum persists as technical indicators signal seller dominance
On the hourly chart, JTO/USD is trading below the 20-period and 50-period moving averages, suggesting short- to medium-term bearish momentum. The price remains well above the 200-period moving average on the daily timeframe, and the Ichimoku Kijun at $0.7563 represents a key resistance level. Both the Moving Average Convergence Divergence (MACD) and the Awesome Oscillator indicate bearish momentum, with the Average Directional Index (ADX) showing neutral trend strength. The Relative Strength Index (RSI) and the Commodity Channel Index (CCI) are signaling in the sell zone, while the Stochastic RSI and ADX are neutral and Bull/Bear Power points to seller dominance intraday.
Downside risk elevated as volatility band limits rebound potential
Over the next two to three trading days, JTO/USD is projected to fluctuate within a volatility band defined by $0.6791 and $0.7407. The probability of further downside remains high, while chances for an upward move are low unless there is a breakout above the immediate resistance at $0.7563. A bearish scenario may materialize if price action falls below the lower bound of the forecasted support range.
Earlier, analysts noted that Jito was demonstrating robust bullish momentum driven by sector interest and protocol developments. The current bearish shift highlights a change in market sentiment, with traders now advised to watch for sustained movement above $0.7563 to signal a potential reversal.














-
 Afghanistan
-
 Albania
-
 Algeria
-
 Angola
-
 Argentina
-
 Armenia
-
 Australia
-
 Austria
-
 Azerbaijan
-
 Bahamas
-
 Bahrain
-
 Bangladesh
-
 Belarus
-
 Belgium
-
 Bolivia
-
 Botswana
-
 Brazil
-
 Brunei
-
 Bulgaria
-
 Cambodia
-
 Cameroon
-
 Canada
-
 Chile
Chile
-
 China
China
-
 Colombia
-
 Congo
Congo
-
 Costa Rica
-
 Cote d'Ivoire
-
 Croatia
-
 Cuba
Cuba
-
 Cyprus
-
 Czechia
-
 DR Congo
-
 Denmark
-
 Dominican Republic
-
 Ecuador
-
 Egypt
Egypt
-
 El Salvador
-
 Estonia
-
 Eswatini
-
 Ethiopia
-
 Finland
-
 France
-
 Georgia
-
 Germany
-
 Ghana
Ghana
-
 Greece
-
 Haiti
Haiti
-
 Hong Kong
-
 Hungary
-
 India
India
-
 Indonesia
-
 Iran, Islamic republic
-
 Iraq
Iraq
-
 Ireland
-
 Israel
-
 Italy
Italy
-
 Jamaica
-
 Japan
Japan
-
 Jordan
-
 Kazakhstan
-
 Kenya
Kenya
-
 Korea
Korea
-
 Kuwait
-
 Kyrgyzstan
-
 Laos
Laos
-
 Latvia
-
 Lebanon
-
 Lesotho
-
 Libya
Libya
-
 Lithuania
-
 Luxembourg
-
 Madagascar
-
 Malaysia
-
 Malta
Malta
-
 Mauritius
-
 Mexico
-
 Moldova
-
 Mongolia
-
 Montenegro
-
 Morocco
-
 Mozambique
-
 Myanmar
-
 Namibia
-
 Nepal
Nepal
-
 Netherlands
-
 New Zealand
-
 Nigeria
-
 North Macedonia
-
 Norway
-
 Oman
Oman
-
 Pakistan
-
 Palestine
-
 Panama
-
 Papua New Guinea
-
 Paraguay
-
 Peru
Peru
-
 Philippines
-
 Poland
-
 Portugal
-
 Puerto Rico
-
 Qatar
Qatar
-
 Reunion
-
 Romania
-
 Rwanda
-
 Saudi Arabia
-
 Serbia
-
 Singapore
-
 Slovakia
-
 Slovenia
-
 Somalia
-
 South Africa
-
 Spain
Spain
-
 Sri Lanka
-
 Sweden
-
 Switzerland
-
 Syria
Syria
-
 Taiwan
-
 Tajikistan
-
 Tanzania
-
 Thailand
-
 Trinidad and Tobago
-
 Tunisia
-
 Turkey
-
 UAE
UAE
-
 Uganda
-
 Ukraine
-
 United Kingdom
-
United States
-
 Uruguay
-
 Uzbekistan
-
 Venezuela
-
 Vietnam
-
 Yemen
Yemen
-
 Zambia
-
 Zimbabwe
- Forex
- Crypto











