
Why is Bitcoin flat today? Support test at $62,603 keeps buyers active

Bitcoin (BTC) is trading at $62,721 after a modest intraday decline. The asset sits above its short-term averages but remains below its longer-term benchmarks.
 64420
64692.83
64420
64692.83
Highlights
- Bitcoin ETFs saw net inflows of 1,439 BTC ($89.69 million), reversing recent outflows and signaling renewed institutional demand.
- Increased ETF activity has boosted market liquidity but failed to lift price action, which remains under broader selling pressure.
- Technical signals favor further downside, with Bitcoin expected to trade between $61,723 and $63,425; bearish continuation risk prevails over the next 2–3 days.
ETF inflows boost liquidity amid renewed institutional positioning
On July 13, 2026, Bitcoin ETFs recorded a net inflow of 1,439 BTC, amounting to roughly $89.69 million, according to Cryptobriefing. This reversal of the previous outflow trend suggests rising institutional demand, as ETF inflows increase market liquidity and indicate renewed interest from larger players. Such shifts in investor positioning can affect available supply and intraday sentiment, though price action has remained under broader selling pressure.
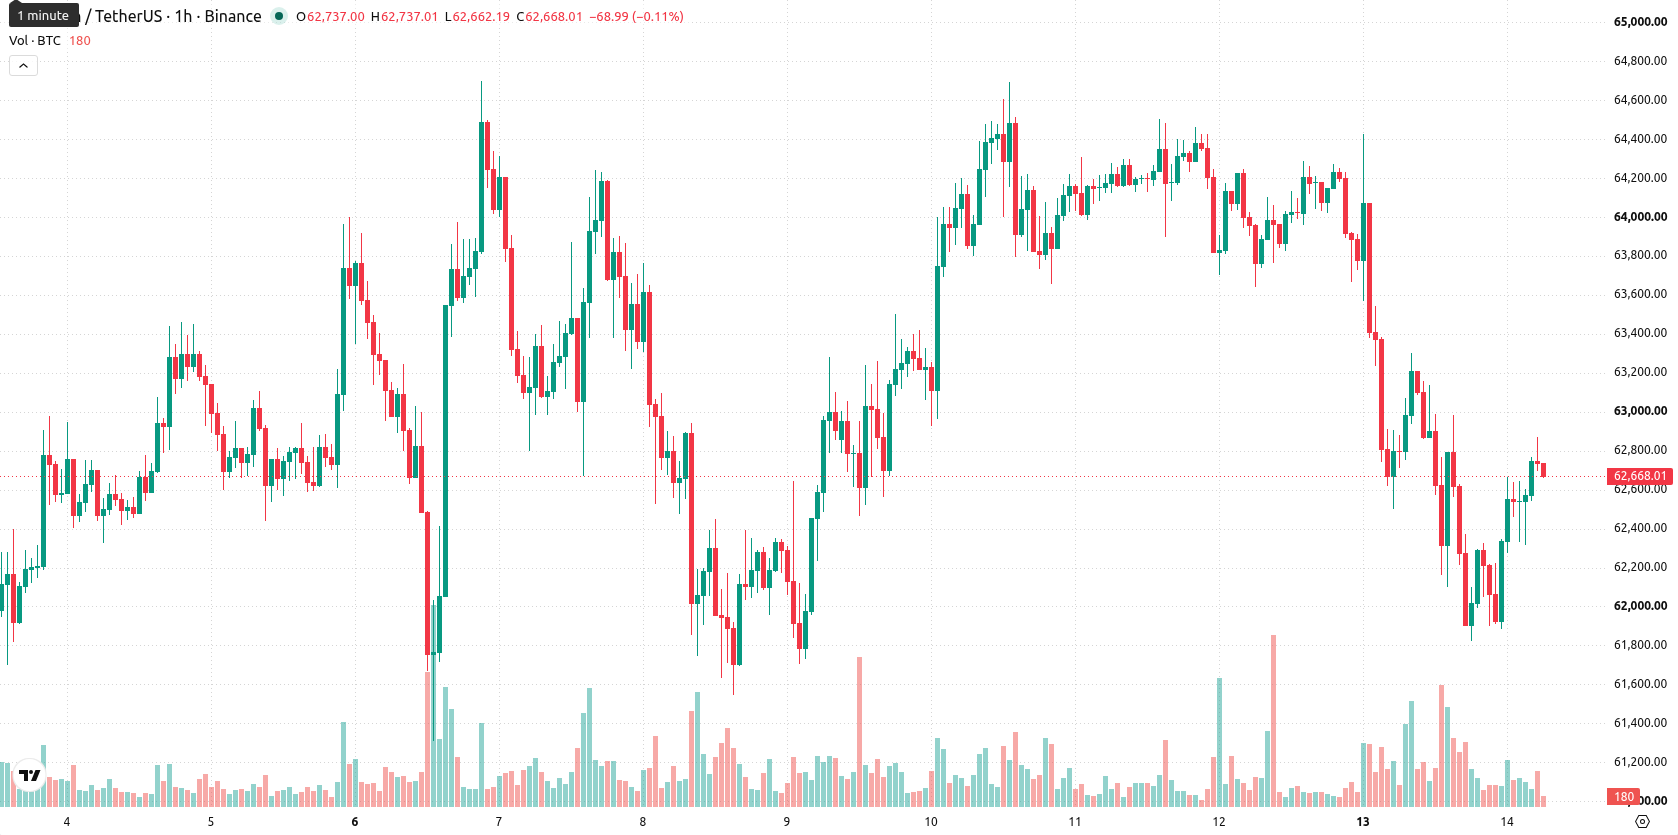
Support at Ichimoku Kijun as indicators flag mixed momentum
BTC faces immediate technical support at the Ichimoku Kijun on the daily chart, positioned at $62,603, while resistance is defined at $63,425. The price is currently above the 20-period moving average ($62,458) but remains below both the 50-period ($63,235) on the H1 and the 200-period moving average ($73,785) on the daily timeframe. Relative Strength Index (RSI) stands at a neutral 50.36 and suggests limited directional momentum, while the Moving Average Convergence Divergence (MACD) indicates strong sell pressure and the Average Directional Index (ADX) highlights a sell bias. Both the Commodity Channel Index (CCI) and Bull/Bear Power (BBP) point to overbought intraday conditions with notable buyer presence; Stochastic RSI also confirms an overbought environment, whereas the Awesome Oscillator remains neutral.
Range-bound trading expected as breakout risks tilt lower
For the next two to three trading days, BTC is likely to remain within a price corridor of $61,723 to $63,425, in line with recent low volatility. There is a 38% probability of an upward break above resistance in the near term, whereas a downward continuation below support is considered more likely at 62%. The baseline scenario sees consolidation within this established range, with directional cues hinging on potential breakouts from these technical barriers.
Previously it was reported that Strategy maintained its sizable Bitcoin reserves while raising additional capital through equity offerings. The recent uptick in ETF inflows highlights a shift in institutional participation, making it critical for traders to monitor potential breakouts above resistance as a trigger for renewed momentum in the coming sessions.






-
 Afghanistan
-
 Albania
-
 Algeria
-
 Angola
-
 Argentina
-
 Armenia
-
 Australia
-
 Austria
-
 Azerbaijan
-
 Bahamas
-
 Bahrain
-
 Bangladesh
-
 Belarus
-
 Belgium
-
 Bolivia
-
 Botswana
-
 Brazil
-
 Brunei
-
 Bulgaria
-
 Cambodia
-
 Cameroon
-
 Canada
-
 Chile
Chile
-
 China
China
-
 Colombia
-
 Congo
Congo
-
 Costa Rica
-
 Cote d'Ivoire
-
 Croatia
-
 Cuba
Cuba
-
 Cyprus
-
 Czechia
-
 DR Congo
-
 Denmark
-
 Dominican Republic
-
 Ecuador
-
 Egypt
Egypt
-
 El Salvador
-
 Estonia
-
 Eswatini
-
 Ethiopia
-
 Finland
-
 France
-
 Georgia
-
 Germany
-
 Ghana
Ghana
-
 Greece
-
 Haiti
Haiti
-
 Hong Kong
-
 Hungary
-
 India
India
-
 Indonesia
-
 Iran, Islamic republic
-
 Iraq
Iraq
-
 Ireland
-
 Israel
-
 Italy
Italy
-
 Jamaica
-
 Japan
Japan
-
 Jordan
-
 Kazakhstan
-
 Kenya
Kenya
-
 Korea
Korea
-
 Kuwait
-
 Kyrgyzstan
-
 Laos
Laos
-
 Latvia
-
 Lebanon
-
 Lesotho
-
 Libya
Libya
-
 Lithuania
-
 Luxembourg
-
 Madagascar
-
 Malaysia
-
 Malta
Malta
-
 Mauritius
-
 Mexico
-
 Moldova
-
 Mongolia
-
 Montenegro
-
 Morocco
-
 Mozambique
-
 Myanmar
-
 Namibia
-
 Nepal
Nepal
-
 Netherlands
-
 New Zealand
-
 Nigeria
-
 North Macedonia
-
 Norway
-
 Oman
Oman
-
 Pakistan
-
 Palestine
-
 Panama
-
 Papua New Guinea
-
 Paraguay
-
 Peru
Peru
-
 Philippines
-
 Poland
-
 Portugal
-
 Puerto Rico
-
 Qatar
Qatar
-
 Reunion
-
 Romania
-
 Rwanda
-
 Saudi Arabia
-
 Serbia
-
 Singapore
-
 Slovakia
-
 Slovenia
-
 Somalia
-
 South Africa
-
 Spain
Spain
-
 Sri Lanka
-
 Sweden
-
 Switzerland
-
 Syria
Syria
-
 Taiwan
-
 Tajikistan
-
 Tanzania
-
 Thailand
-
 Trinidad and Tobago
-
 Tunisia
-
 Turkey
-
 UAE
UAE
-
 Uganda
-
 Ukraine
-
 United Kingdom
-
United States
-
 Uruguay
-
 Uzbekistan
-
 Venezuela
-
 Vietnam
-
 Yemen
Yemen
-
 Zambia
-
 Zimbabwe
- Forex
- Crypto











