
Oversold conditions limit further downside. Can DeXe avoid deeper losses?

DeXe (DEXE) is trading at $38.43, down 8.24% on the day. The asset sits below its short- and medium-term moving averages, while still holding above longer-term trend levels.
 41.51
49.43
41.51
49.43
Highlights
- DeXe's listing on the MGBX exchange on July 13, 2026, increased liquidity and broadened market access, driving elevated trading activity.
- A surge of over 1,000% in DeXe’s price over six months, including 45% in the week before listing, raises risks of post-event correction as early holders reconsider positions.
- Technical indicators signal strong bearish momentum with DeXe trading below key averages and a projected range of $32.99 to $43.87, making further declines likely.
Liquidity increases and volatility spike after major exchange listing
DeXe’s listing on the MGBX cryptocurrency exchange on July 13, 2026 expanded its market presence and introduced the asset to a wider trading base, according to Pluang. Such listings typically create additional liquidity and prompt heightened trading activity, setting the stage for short-term volatility as new participants engage. In the six months preceding the listing, DeXe had recorded over a 1,000% gain, including a 45% increase in the week prior, which positioned the asset for potential post-event corrections as early traders reassess their positions.
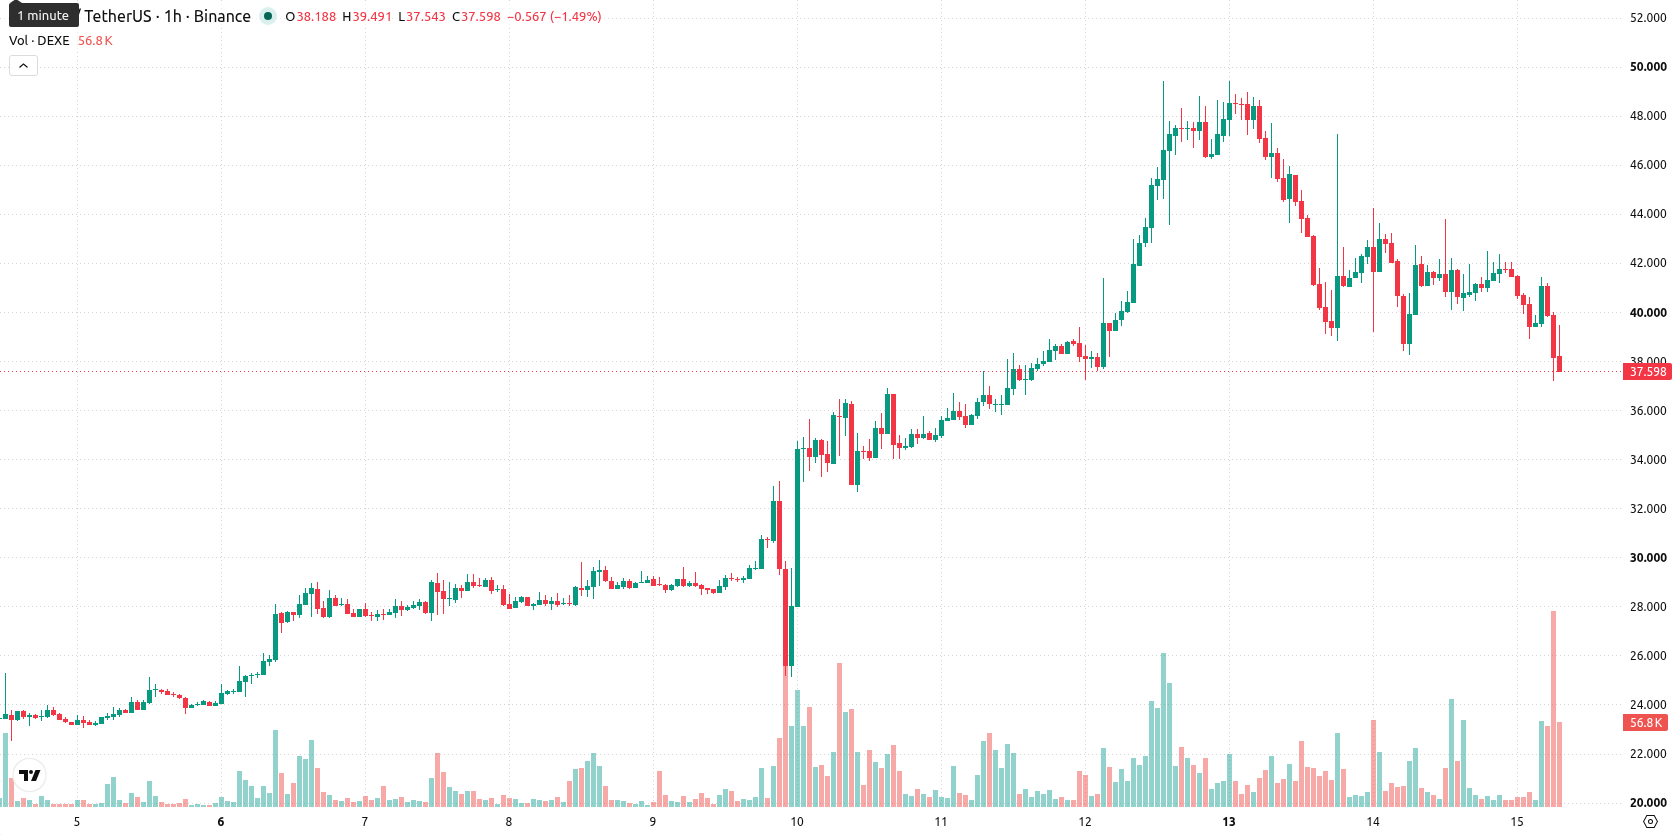
Bearish momentum as price tests resistance and oversold signals emerge
On the hourly chart, DEXE is trading below both the MA-20 at $40.79 and MA-50 at $41.77, with the MA-200 offering longer-term support at $10.63. The Ichimoku Kijun line is set at $40.64, acting as immediate resistance. Momentum indicators reinforce ongoing seller control: the Moving Average Convergence Divergence (MACD) signals a sell, the Average Directional Index (ADX) is neutral, and the Relative Strength Index (RSI) stands at 36.42, while Stochastic RSI, Commodity Channel Index (CCI), and Bull/Bear Power all highlight oversold conditions. The Awesome Oscillator aligns with the prevailing bearish sentiment, with high volatility supporting a bias toward further downside in the immediate term.
Downside favors persist under broad trading range risk
Looking ahead to the next two to three trading days, DEXE is likely to fluctuate within a volatile band between $32.99 and $43.87. With a 76% probability skewed toward further downside, the base expectation is for the price to remain in this broad range. Should a breakout occur above $40.64 resistance, a bullish reversal could gain traction; failure to hold $32.99 would point to continued selling pressure.
Earlier, analysts noted that DeXe’s price action was underpinned by strong technical momentum and increased large-holder activity, despite intermittent bouts of volatility and selling pressure. In light of the current consolidation below key averages and heightened volatility following the recent exchange listing, traders should closely monitor for a decisive move outside the $32.99–$43.87 range as a signal of the next directional trend.








-
 Afghanistan
-
 Albania
-
 Algeria
-
 Angola
-
 Argentina
-
 Armenia
-
 Australia
-
 Austria
-
 Azerbaijan
-
 Bahamas
-
 Bahrain
-
 Bangladesh
-
 Belarus
-
 Belgium
-
 Bolivia
-
 Botswana
-
 Brazil
-
 Brunei
-
 Bulgaria
-
 Cambodia
-
 Cameroon
-
 Canada
-
 Chile
Chile
-
 China
China
-
 Colombia
-
 Congo
Congo
-
 Costa Rica
-
 Cote d'Ivoire
-
 Croatia
-
 Cuba
Cuba
-
 Cyprus
-
 Czechia
-
 DR Congo
-
 Denmark
-
 Dominican Republic
-
 Ecuador
-
 Egypt
Egypt
-
 El Salvador
-
 Estonia
-
 Eswatini
-
 Ethiopia
-
 Finland
-
 France
-
 Georgia
-
 Germany
-
 Ghana
Ghana
-
 Greece
-
 Haiti
Haiti
-
 Hong Kong
-
 Hungary
-
 India
India
-
 Indonesia
-
 Iran, Islamic republic
-
 Iraq
Iraq
-
 Ireland
-
 Israel
-
 Italy
Italy
-
 Jamaica
-
 Japan
Japan
-
 Jordan
-
 Kazakhstan
-
 Kenya
Kenya
-
 Korea
Korea
-
 Kuwait
-
 Kyrgyzstan
-
 Laos
Laos
-
 Latvia
-
 Lebanon
-
 Lesotho
-
 Libya
Libya
-
 Lithuania
-
 Luxembourg
-
 Madagascar
-
 Malaysia
-
 Malta
Malta
-
 Mauritius
-
 Mexico
-
 Moldova
-
 Mongolia
-
 Montenegro
-
 Morocco
-
 Mozambique
-
 Myanmar
-
 Namibia
-
 Nepal
Nepal
-
 Netherlands
-
 New Zealand
-
 Nigeria
-
 North Macedonia
-
 Norway
-
 Oman
Oman
-
 Pakistan
-
 Palestine
-
 Panama
-
 Papua New Guinea
-
 Paraguay
-
 Peru
Peru
-
 Philippines
-
 Poland
-
 Portugal
-
 Puerto Rico
-
 Qatar
Qatar
-
 Reunion
-
 Romania
-
 Rwanda
-
 Saudi Arabia
-
 Serbia
-
 Singapore
-
 Slovakia
-
 Slovenia
-
 Somalia
-
 South Africa
-
 Spain
Spain
-
 Sri Lanka
-
 Sweden
-
 Switzerland
-
 Syria
Syria
-
 Taiwan
-
 Tajikistan
-
 Tanzania
-
 Thailand
-
 Trinidad and Tobago
-
 Tunisia
-
 Turkey
-
 UAE
UAE
-
 Uganda
-
 Ukraine
-
 United Kingdom
-
United States
-
 Uruguay
-
 Uzbekistan
-
 Venezuela
-
 Vietnam
-
 Yemen
Yemen
-
 Zambia
-
 Zimbabwe
- Forex
- Crypto











