
Solana trades near $76.23–$78.73 range amid oversold bounce in progress

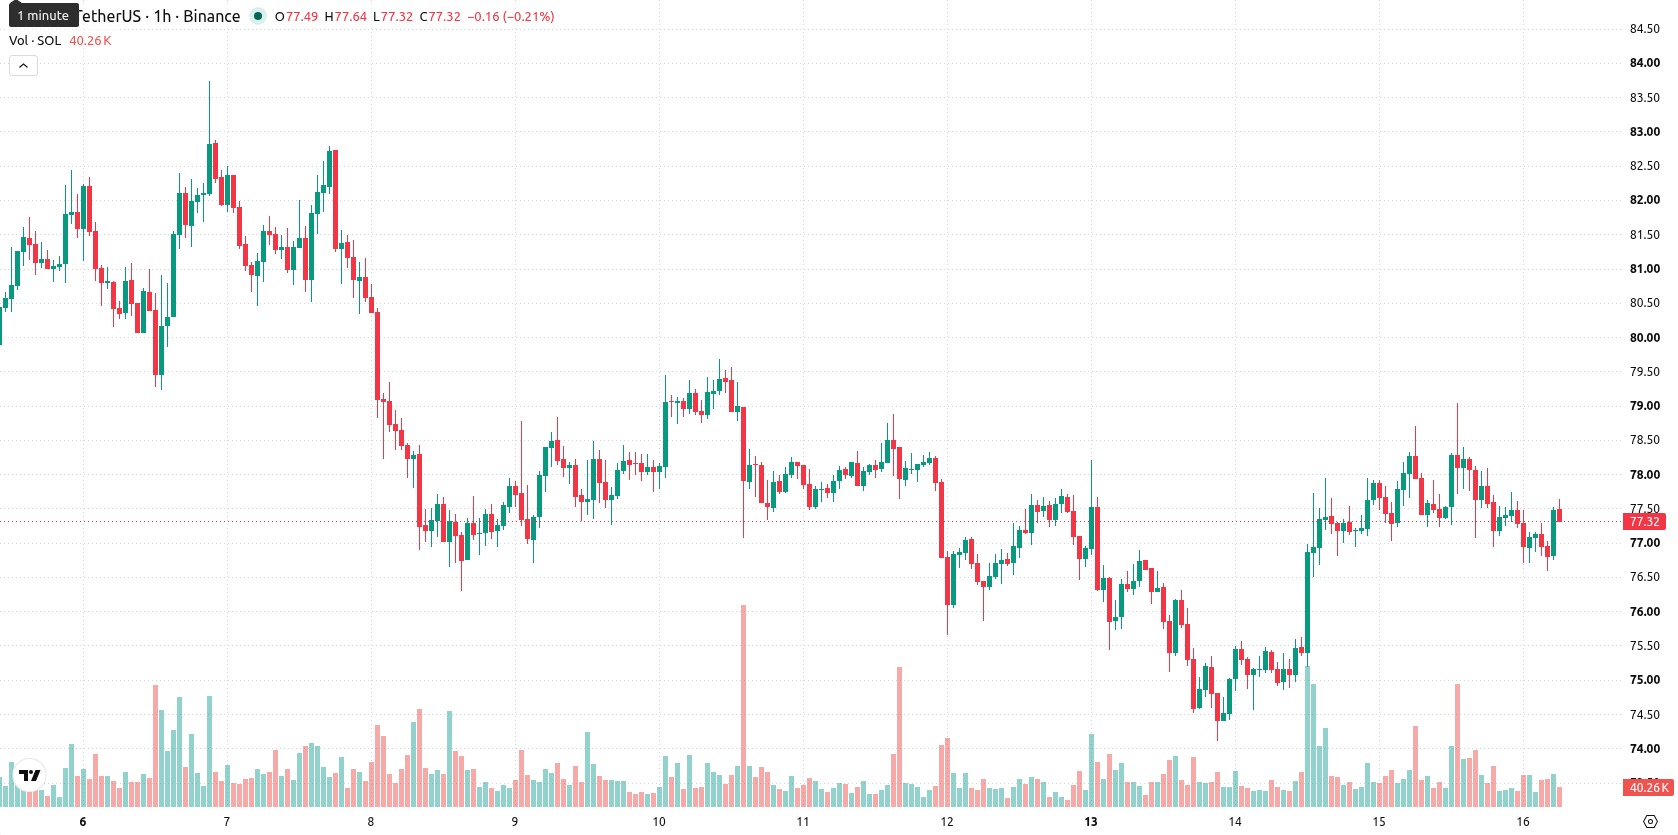
Solana (SOL) is trading at $77.48 today, marking a daily decline of 1.07%. The asset currently stands above its short- and medium-term moving averages, while remaining below longer-term trend levels.
 76.7
79.04
76.7
79.04
Highlights
- Morgan Stanley's proposed spot Solana ETF allows up to 100% staking and appoints Coinbase as custodian, pending SEC approval.
- Solana ecosystem gains momentum from 250 million USDC minted and new Japanese partnerships, boosting liquidity and long-term adoption potential.
- SOL/USD faces near-term price consolidation between $76.23 and $78.73, with indicators showing mixed momentum and high probability of sideways to modestly bullish movement.
Institutional ETF filings spur network activity amid sustained selling
Morgan Stanley has filed updated S-1 registrations for a proposed spot Solana ETF (MSOL), enabling up to 100% staking of holdings and appointing Coinbase as custodian, though the launch remains contingent on SEC approval, according to News Bitcoin. This regulatory move signals heightened institutional interest in Solana and could pave the way for broader access to staking products if approved. Separately, Solana’s ecosystem activity saw a notable uptick following the minting of 250 million USDC, as reported by Crypto, which elevated network liquidity and transaction capacity. Additional momentum came from SBI Holdings' partnerships in Japan, including the launch of the JX token with DigiFT and plans to build an on-chain financial ecosystem in collaboration with the Solana Foundation, supporting longer-term network adoption — though price action has remained under broader selling pressure.
Mixed momentum clouds outlook as technical resistance caps price
Technically, the immediate resistance is marked by the Ichimoku Kijun at $77.82. Hourly price action sits above both the MA-20 and MA-50, but remains below the daily MA-200 level. Mixed momentum signals are present: the Moving Average Convergence Divergence (MACD) shows a sell indication, while the Average Directional Index (ADX) is neutral, reflecting unclear trend strength. The Relative Strength Index (RSI) stands at 51.51 and is joined by a strong buy signal from the Stochastic RSI, suggesting a mild bounce from oversold conditions. However, the Commodity Channel Index (CCI) continues to signal sell and Bull/Bear Power shows dominant sellers intraday, adding to market uncertainty.
Consolidation favored as breakout risks remain subdued
In the short term, SOL/USD is expected to remain rangebound, fluctuating between $76.23 and $78.73. Typical volatility favors a sideways move as price consolidates within these limits. A bullish scenario would require a confirmed breakout above immediate resistance, with more momentum likely if the $77.82 area is breached, while a drop below support could trigger further downside even though this probability is currently low.
Earlier, analysts noted that while Solana had underperformed larger peers, its robust on-chain activity and solid fundamentals continued to support long-term ecosystem health. The latest developments—including heightened institutional interest, fresh liquidity boosts, and new international partnerships—add further positive drivers, making the $77.82 resistance a pivotal level to watch for any potential breakout from the current consolidation range.








-
 Afghanistan
-
 Albania
-
 Algeria
-
 Angola
-
 Argentina
-
 Armenia
-
 Australia
-
 Austria
-
 Azerbaijan
-
 Bahamas
-
 Bahrain
-
 Bangladesh
-
 Belarus
-
 Belgium
-
 Bolivia
-
 Botswana
-
 Brazil
-
 Brunei
-
 Bulgaria
-
 Cambodia
-
 Cameroon
-
 Canada
-
 Chile
Chile
-
 China
China
-
 Colombia
-
 Congo
Congo
-
 Costa Rica
-
 Cote d'Ivoire
-
 Croatia
-
 Cuba
Cuba
-
 Cyprus
-
 Czechia
-
 DR Congo
-
 Denmark
-
 Dominican Republic
-
 Ecuador
-
 Egypt
Egypt
-
 El Salvador
-
 Estonia
-
 Eswatini
-
 Ethiopia
-
 Finland
-
 France
-
 Georgia
-
 Germany
-
 Ghana
Ghana
-
 Greece
-
 Haiti
Haiti
-
 Hong Kong
-
 Hungary
-
 India
India
-
 Indonesia
-
 Iran, Islamic republic
-
 Iraq
Iraq
-
 Ireland
-
 Israel
-
 Italy
Italy
-
 Jamaica
-
 Japan
Japan
-
 Jordan
-
 Kazakhstan
-
 Kenya
Kenya
-
 Korea
Korea
-
 Kuwait
-
 Kyrgyzstan
-
 Laos
Laos
-
 Latvia
-
 Lebanon
-
 Lesotho
-
 Libya
Libya
-
 Lithuania
-
 Luxembourg
-
 Madagascar
-
 Malaysia
-
 Malta
Malta
-
 Mauritius
-
 Mexico
-
 Moldova
-
 Mongolia
-
 Montenegro
-
 Morocco
-
 Mozambique
-
 Myanmar
-
 Namibia
-
 Nepal
Nepal
-
 Netherlands
-
 New Zealand
-
 Nigeria
-
 North Macedonia
-
 Norway
-
 Oman
Oman
-
 Pakistan
-
 Palestine
-
 Panama
-
 Papua New Guinea
-
 Paraguay
-
 Peru
Peru
-
 Philippines
-
 Poland
-
 Portugal
-
 Puerto Rico
-
 Qatar
Qatar
-
 Reunion
-
 Romania
-
 Rwanda
-
 Saudi Arabia
-
 Serbia
-
 Singapore
-
 Slovakia
-
 Slovenia
-
 Somalia
-
 South Africa
-
 Spain
Spain
-
 Sri Lanka
-
 Sweden
-
 Switzerland
-
 Syria
Syria
-
 Taiwan
-
 Tajikistan
-
 Tanzania
-
 Thailand
-
 Trinidad and Tobago
-
 Tunisia
-
 Turkey
-
 UAE
UAE
-
 Uganda
-
 Ukraine
-
 United Kingdom
-
United States
-
 Uruguay
-
 Uzbekistan
-
 Venezuela
-
 Vietnam
-
 Yemen
Yemen
-
 Zambia
-
 Zimbabwe
- Forex
- Crypto











