
SOL pulls back as sellers dominate the market trend

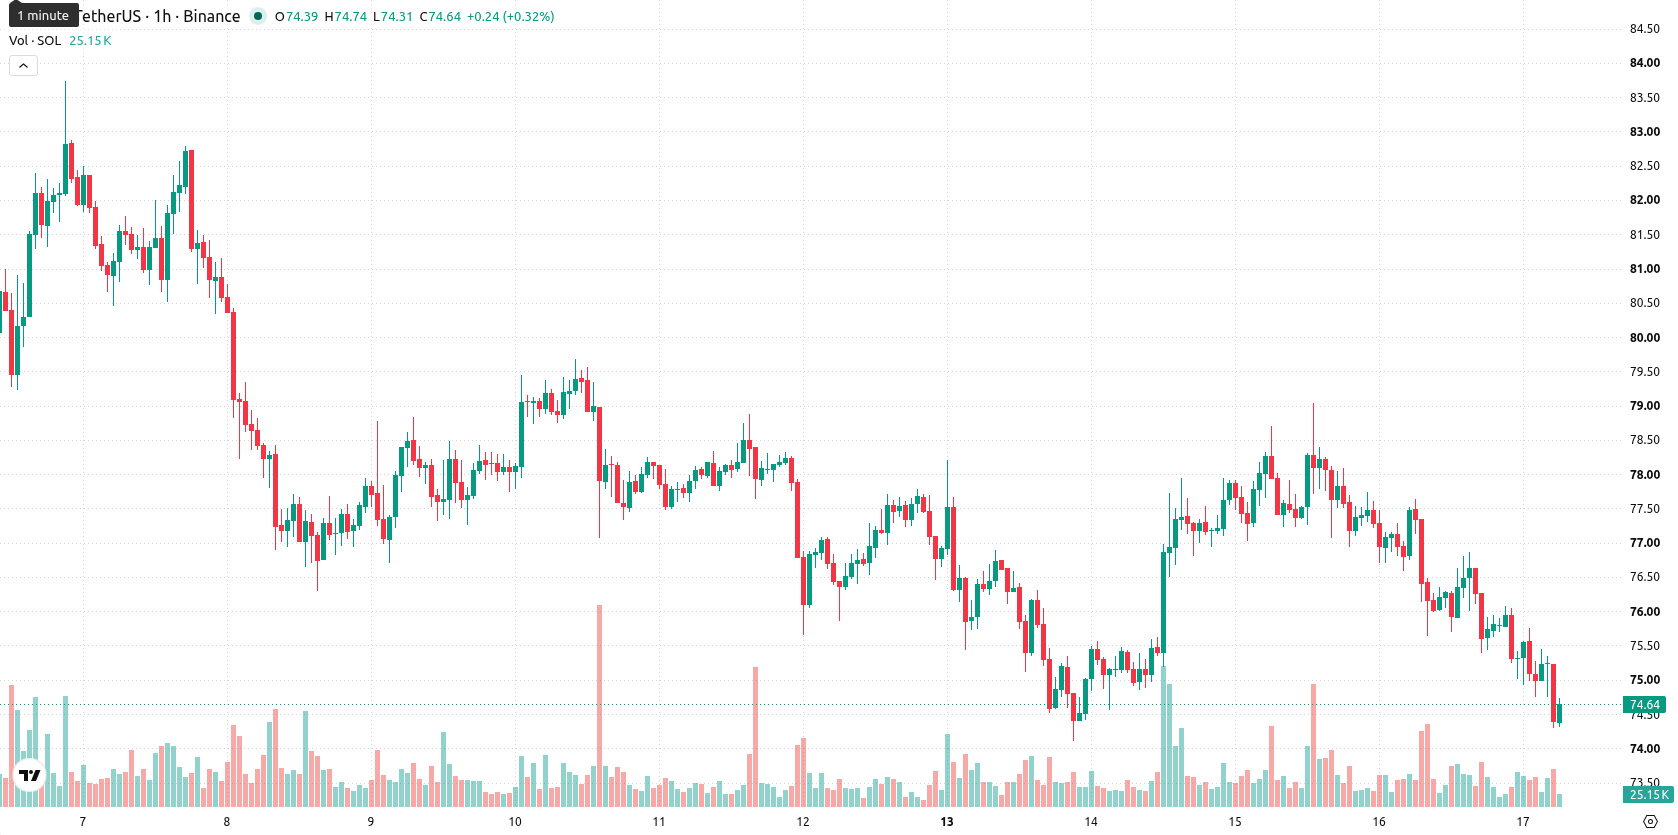
Solana (SOL) is trading at $74.46, down 3.86% for the session as it continues to move lower for the day. The asset is positioned below its key moving averages, signaling ongoing weakness relative to recent trends.
 77.4
79.04
77.4
79.04
Highlights
- Morgan Stanley filed for a Solana ETF on NYSE Arca with a 0.14% sponsor fee and potential for staking, but regulatory approval is pending.
- E*Trade enabled retail trading of SOL and Solana surpassed 300,000 real-world asset holders, indicating expanding on-chain and retail adoption.
- SOL trades below all key moving averages with strong bearish momentum, projected to consolidate between $73.36 and $75.56; downside risk dominates.
ETF filings and retail expansion muted by unapproved status and selling pressure
Morgan Stanley filed an amended registration statement on July 14, 2026 for its proposed Solana ETF to be listed on NYSE Arca, introducing a 0.14% sponsor fee and the option to stake all fund holdings, as reported by Themarketperiodical. This signals attempts to expand institutional product offerings around Solana, though the ETF remains unapproved at this stage, thus limiting any immediate demand impact. Separately, Decrypt reported that E*Trade enabled buying, selling, and holding of SOL for eligible customers on July 16, 2026, broadening retail accessibility, while Hokanews noted that Solana has now surpassed 300,000 real-world asset holders, highlighting continuing on-chain adoption—though price action has remained under broader selling pressure.
Oversold signals as technical barriers align with weak momentum
SOL/USD is trading below the MA-20 at $75.72, the MA-50 at $76.74, and far under the MA-200 at $90.86. The Ichimoku Kijun serves as immediate resistance at $76.12. Momentum indicators confirm a weak backdrop: the Moving Average Convergence Divergence (MACD) and Average Directional Index (ADX) both point to a Sell bias, while the Relative Strength Index (RSI) stands at 31.02—well within oversold territory. The Stochastic RSI, Commodity Channel Index (CCI), and Bull/Bear Power also indicate strong selling pressure, while the Awesome Oscillator remains neutral, not reinforcing the current move.
Downside risk elevated as rangebound action likely to persist
Over the next two to three sessions, price action is expected to stay within the $73.36 to $75.56 range, representing the typical volatility band relative to current levels. The up probability is assessed as very low, and the likelihood of further downside is high. A baseline scenario would see consolidation within this band, with a potential bullish setup only emerging if resistance around $76.12 is broken. Conversely, renewed selling could materialize if support at $73.36 fails, opening room for further downside pressure.
Earlier, analysts noted that persistent technical weakness was the dominant theme for Solana despite underlying ecosystem developments and emerging ETF proposals. The current analysis reinforces this bearish backdrop, highlighting that renewed downside risk could emerge if $73.36 support is breached in the coming sessions.


Latest Solana News





-
 Afghanistan
-
 Albania
-
 Algeria
-
 Angola
-
 Argentina
-
 Armenia
-
 Australia
-
 Austria
-
 Azerbaijan
-
 Bahamas
-
 Bahrain
-
 Bangladesh
-
 Belarus
-
 Belgium
-
 Bolivia
-
 Botswana
-
 Brazil
-
 Brunei
-
 Bulgaria
-
 Cambodia
-
 Cameroon
-
 Canada
-
 Chile
Chile
-
 China
China
-
 Colombia
-
 Congo
Congo
-
 Costa Rica
-
 Cote d'Ivoire
-
 Croatia
-
 Cuba
Cuba
-
 Cyprus
-
 Czechia
-
 DR Congo
-
 Denmark
-
 Dominican Republic
-
 Ecuador
-
 Egypt
Egypt
-
 El Salvador
-
 Estonia
-
 Eswatini
-
 Ethiopia
-
 Finland
-
 France
-
 Georgia
-
 Germany
-
 Ghana
Ghana
-
 Greece
-
 Haiti
Haiti
-
 Hong Kong
-
 Hungary
-
 India
India
-
 Indonesia
-
 Iran, Islamic republic
-
 Iraq
Iraq
-
 Ireland
-
 Israel
-
 Italy
Italy
-
 Jamaica
-
 Japan
Japan
-
 Jordan
-
 Kazakhstan
-
 Kenya
Kenya
-
 Korea
Korea
-
 Kuwait
-
 Kyrgyzstan
-
 Laos
Laos
-
 Latvia
-
 Lebanon
-
 Lesotho
-
 Libya
Libya
-
 Lithuania
-
 Luxembourg
-
 Madagascar
-
 Malaysia
-
 Malta
Malta
-
 Mauritius
-
 Mexico
-
 Moldova
-
 Mongolia
-
 Montenegro
-
 Morocco
-
 Mozambique
-
 Myanmar
-
 Namibia
-
 Nepal
Nepal
-
 Netherlands
-
 New Zealand
-
 Nigeria
-
 North Macedonia
-
 Norway
-
 Oman
Oman
-
 Pakistan
-
 Palestine
-
 Panama
-
 Papua New Guinea
-
 Paraguay
-
 Peru
Peru
-
 Philippines
-
 Poland
-
 Portugal
-
 Puerto Rico
-
 Qatar
Qatar
-
 Reunion
-
 Romania
-
 Rwanda
-
 Saudi Arabia
-
 Serbia
-
 Singapore
-
 Slovakia
-
 Slovenia
-
 Somalia
-
 South Africa
-
 Spain
Spain
-
 Sri Lanka
-
 Sweden
-
 Switzerland
-
 Syria
Syria
-
 Taiwan
-
 Tajikistan
-
 Tanzania
-
 Thailand
-
 Trinidad and Tobago
-
 Tunisia
-
 Turkey
-
 UAE
UAE
-
 Uganda
-
 Ukraine
-
 United Kingdom
-
United States
-
 Uruguay
-
 Uzbekistan
-
 Venezuela
-
 Vietnam
-
 Yemen
Yemen
-
 Zambia
-
 Zimbabwe
- Forex
- Crypto











