
Solana slips toward lower recent range as MACD shows strong sell signal: weekly outlook

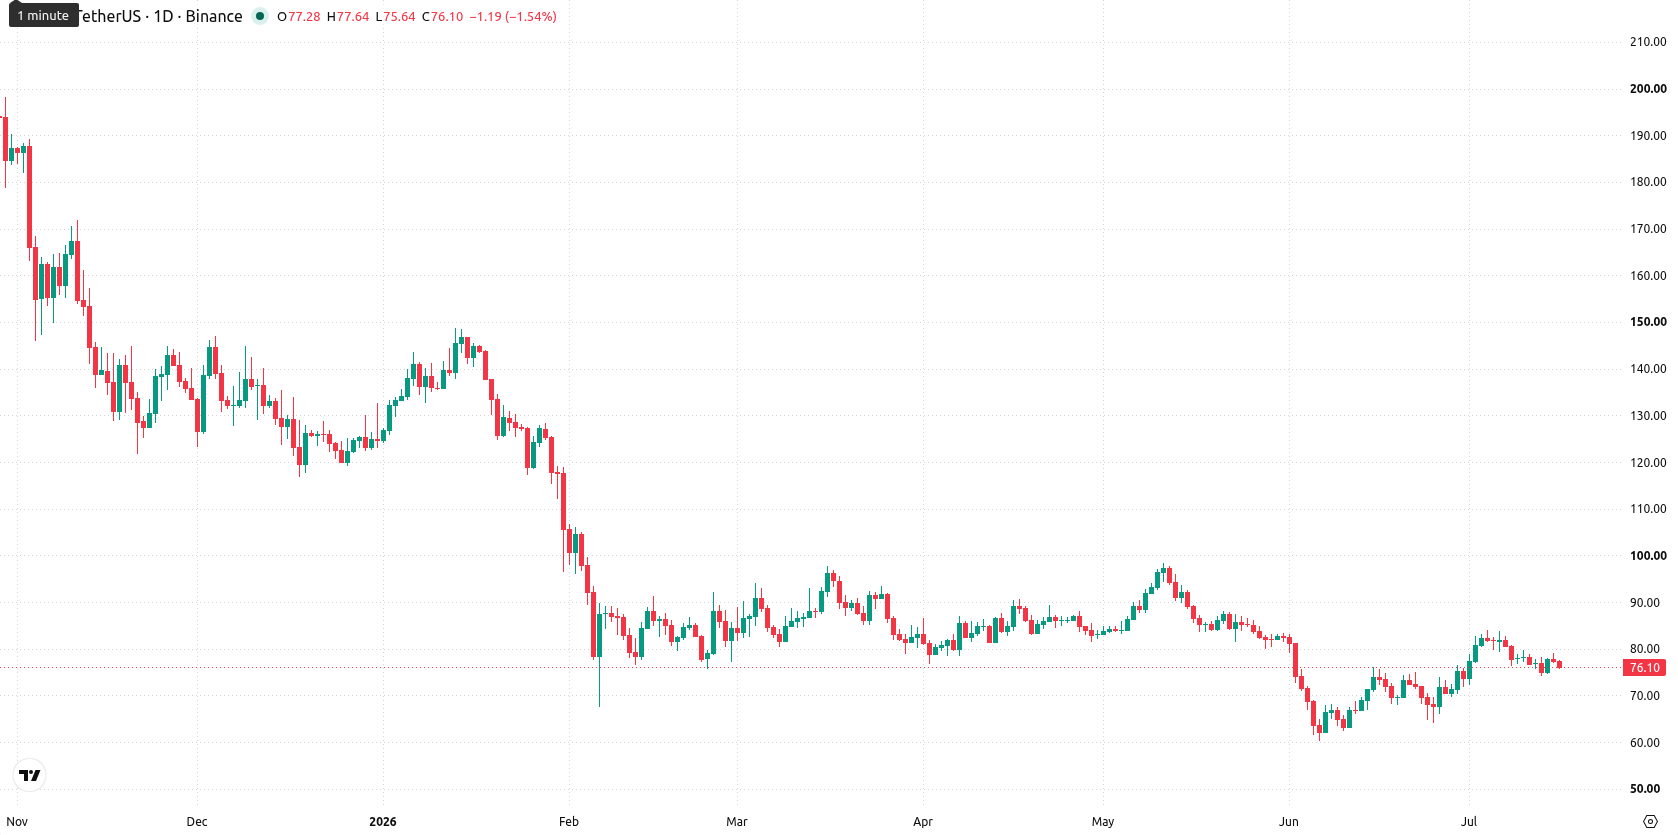
Solana (SOL) is trading at $76.20 after declining $1.90, or 2.48%, over the past week. The asset remains below all major weekly moving averages — MA-20 ($81.32), MA-50 ($127.01), and MA-200 ($107.57) — confirming ongoing selling pressure and positioning SOL in the lower section of its recent trading range.
 75.67
79.04
75.67
79.04
Highlights
- Solana remains under persistent selling pressure, trading firmly below key moving averages with momentum and oscillators signaling a bearish trend.
- Over the past week, SOL declined 2.48% and continues to trade in the lower part of its range, with weekly volatility at 7.53%.
- The expected range for the upcoming week is $70.40 to $81.80, with a high probability of further downside unless $81.80 is reclaimed.
Ecosystem sentiment improves as ETF progress and tokenization initiatives advance
Morgan Stanley’s updated regulatory filing for a spot Solana ETF, which proposes a 0.14% annual management fee and a staking feature for up to 100% of SOL holdings, stands out as a key development pending SEC approval. The Solana Foundation’s collaboration with Japan’s SBI Holdings aims to expand on-chain financial infrastructure and real-world asset tokenization, further strengthening ecosystem growth. Network activity was also bolstered this week after the USDC Treasury minted 250 million USDC on Solana.
Bearish momentum reinforced as weekly signals cluster in negative territory
Weekly technical signals remain uniformly bearish, with SOL entrenched below its 20-, 50-, and 200-week moving averages, signaling persistent downward momentum. The MACD indicates a Strong Sell, with the ADX confirming robust bearish trend strength. RSI and Commodity Channel Index both flag a Sell, while the Stochastic RSI is Neutral — and Bull/Bear Power remains deeply negative at -0.80. The Awesome Oscillator does not contradict this prevailing negative structure, and weekly volatility is measured at 7.53%, keeping prices anchored in the lower end of the stated range.
Sideways-to-lower trajectory favored as bullish break odds stay limited
For the next 7 days, technicals suggest continued sideways or lower trading, with the expected range set between $70.40 and $81.80. Upward movement is unlikely, with less than a 20% probability of a bullish break toward or above $81.80, as all major weekly indicators remain in sell territory. The baseline view is for SOL to hold within the lower half of its range; a bearish scenario would see a break below $74, targeting the bottom of the projected corridor.
Earlier, analysts noted that Solana’s strong on-chain fundamentals were providing support despite extended price consolidation. With new ecosystem partnerships and ETF developments now emerging against a decidedly bearish technical backdrop, traders should watch for whether SOL can defend the $74 level this week to avert a deeper decline.








-
 Afghanistan
-
 Albania
-
 Algeria
-
 Angola
-
 Argentina
-
 Armenia
-
 Australia
-
 Austria
-
 Azerbaijan
-
 Bahamas
-
 Bahrain
-
 Bangladesh
-
 Belarus
-
 Belgium
-
 Bolivia
-
 Botswana
-
 Brazil
-
 Brunei
-
 Bulgaria
-
 Cambodia
-
 Cameroon
-
 Canada
-
 Chile
Chile
-
 China
China
-
 Colombia
-
 Congo
Congo
-
 Costa Rica
-
 Cote d'Ivoire
-
 Croatia
-
 Cuba
Cuba
-
 Cyprus
-
 Czechia
-
 DR Congo
-
 Denmark
-
 Dominican Republic
-
 Ecuador
-
 Egypt
Egypt
-
 El Salvador
-
 Estonia
-
 Eswatini
-
 Ethiopia
-
 Finland
-
 France
-
 Georgia
-
 Germany
-
 Ghana
Ghana
-
 Greece
-
 Haiti
Haiti
-
 Hong Kong
-
 Hungary
-
 India
India
-
 Indonesia
-
 Iran, Islamic republic
-
 Iraq
Iraq
-
 Ireland
-
 Israel
-
 Italy
Italy
-
 Jamaica
-
 Japan
Japan
-
 Jordan
-
 Kazakhstan
-
 Kenya
Kenya
-
 Korea
Korea
-
 Kuwait
-
 Kyrgyzstan
-
 Laos
Laos
-
 Latvia
-
 Lebanon
-
 Lesotho
-
 Libya
Libya
-
 Lithuania
-
 Luxembourg
-
 Madagascar
-
 Malaysia
-
 Malta
Malta
-
 Mauritius
-
 Mexico
-
 Moldova
-
 Mongolia
-
 Montenegro
-
 Morocco
-
 Mozambique
-
 Myanmar
-
 Namibia
-
 Nepal
Nepal
-
 Netherlands
-
 New Zealand
-
 Nigeria
-
 North Macedonia
-
 Norway
-
 Oman
Oman
-
 Pakistan
-
 Palestine
-
 Panama
-
 Papua New Guinea
-
 Paraguay
-
 Peru
Peru
-
 Philippines
-
 Poland
-
 Portugal
-
 Puerto Rico
-
 Qatar
Qatar
-
 Reunion
-
 Romania
-
 Rwanda
-
 Saudi Arabia
-
 Serbia
-
 Singapore
-
 Slovakia
-
 Slovenia
-
 Somalia
-
 South Africa
-
 Spain
Spain
-
 Sri Lanka
-
 Sweden
-
 Switzerland
-
 Syria
Syria
-
 Taiwan
-
 Tajikistan
-
 Tanzania
-
 Thailand
-
 Trinidad and Tobago
-
 Tunisia
-
 Turkey
-
 UAE
UAE
-
 Uganda
-
 Ukraine
-
 United Kingdom
-
United States
-
 Uruguay
-
 Uzbekistan
-
 Venezuela
-
 Vietnam
-
 Yemen
Yemen
-
 Zambia
-
 Zimbabwe
- Forex
- Crypto











