
Why is Ethereum falling today? Selloff accelerates amid support pressure near key level

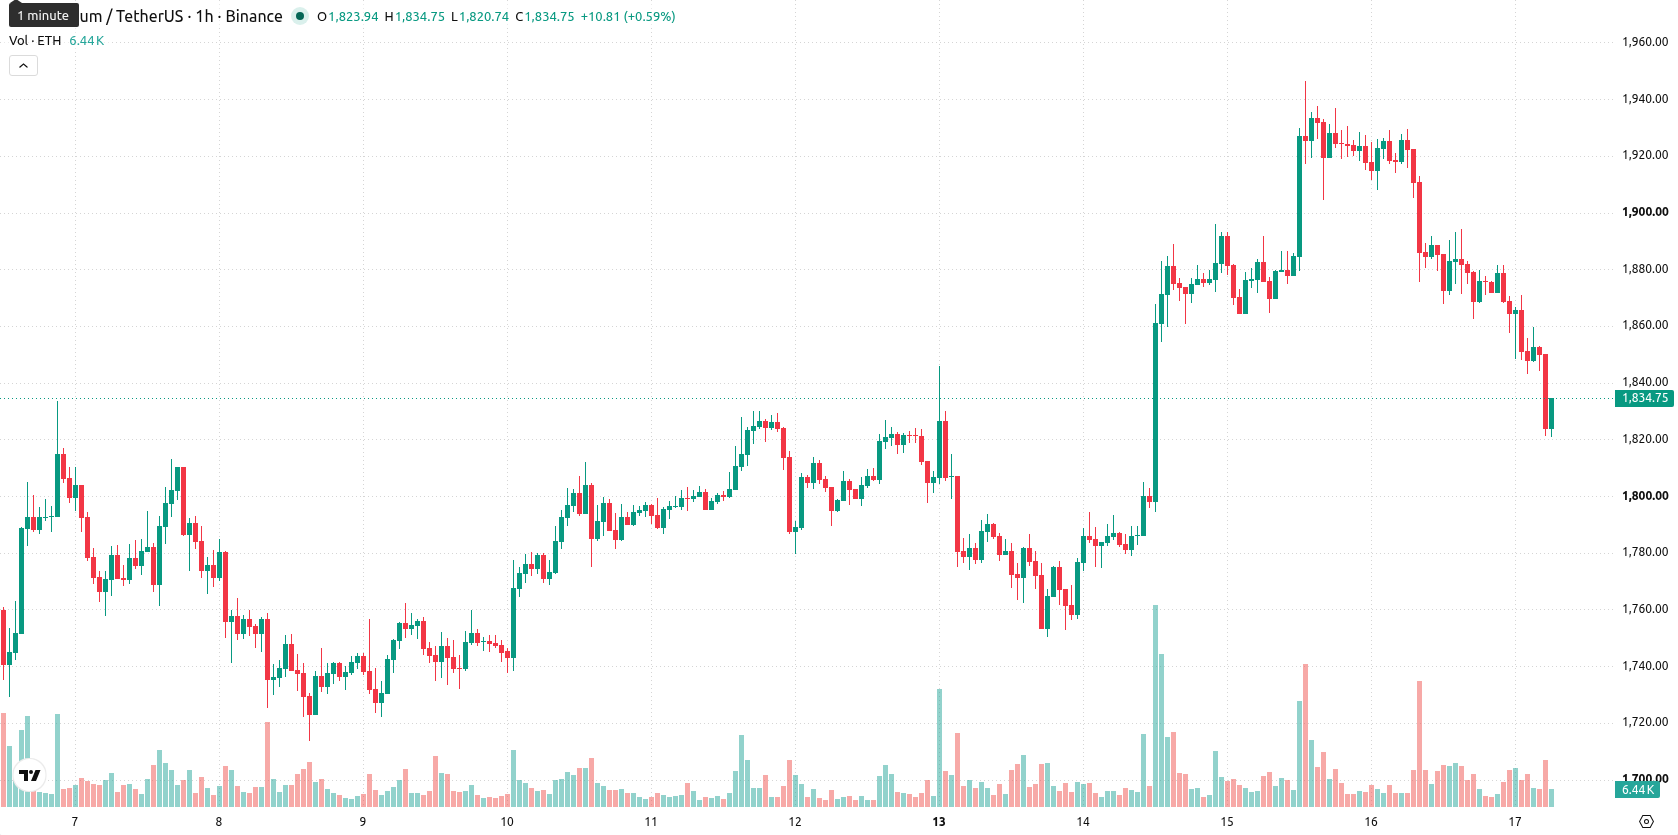
Ethereum (ETH) is trading at $1,829.99 after a daily decline of 4.94%. The asset currently sits below its key moving averages, indicating broad-based downward movement.
 1891.71
1946.52
1891.71
1946.52
Highlights
- Spot Ethereum ETFs saw $84 million in weekly net inflows, ending an eight-week streak of outflows as institutional demand revived, led by BlackRock’s ETHA fund.
- Additional $96 million in U.S. Ether ETF inflows and strong decentralized exchange activity on Robinhood Chain signal increased institutional and network engagement even as price remains pressured.
- ETH/USD is consolidating within a $1,786–$1,894 range as bearish momentum dominates, with technicals indicating a 79% probability of further downside.
Institutional inflows revive as ETF demand rebounds after outflows
Spot Ethereum exchange-traded funds recorded $84 million in net inflows for the week ending July 11, breaking an eight-week streak of withdrawals and with most of the inflows concentrated in BlackRock’s ETHA fund, according to Cryptonews. This reversal marked a return of institutional demand, further evidenced by an additional $96 million in U.S. spot Ether ETF inflows over the three prior days, with BlackRock again leading, as CoinDesk reported. Secondary developments included the launch of Robinhood Chain, whose Arbitrum-based Ethereum Layer 2 network exceeded $800 million in daily decentralized exchange volume, supporting network activity, and a $57.7 million withdrawal of ETH from Coinbase Prime by BitMine Immersion Technologies, alongside recent roadmap disclosures from co-founder Vitalik Buterin — though price action has remained under broader selling pressure.
Oversold signals mount as technical resistance caps recovery
On the hourly chart, ETH/USD is trading below the 20-period ($1,868) and 50-period ($1,892) moving averages, as well as below the daily 200-period moving average at $2,201. The Ichimoku Kijun level at $1,879 represents immediate resistance, with price action held beneath this threshold. Momentum indicators reinforce negative conditions: the Moving Average Convergence Divergence (MACD) and Average Directional Index (ADX) both indicate a selling environment. The Relative Strength Index (RSI) is deeply oversold at 25.52, while the Stochastic RSI and Commodity Channel Index (CCI) also confirm pronounced oversold status. Bull/Bear Power remains in oversold territory, and the Awesome Oscillator supports ongoing negative momentum. ETH/USD opened with a $60.33 gap below the previous close and continues to trade near session lows amid moderate volatility, consistent with oscillator and momentum signals.
Downside risk dominates as volatility constrains breakout odds
Over the next 2–3 trading days, ETH/USD is likely to consolidate within the $1,786 to $1,894 range as typical volatility persists. There is a 21% probability of an upward move, with a much higher chance of continued downside at 79%. Price action is expected to remain confined to this corridor, with a bullish scenario requiring a break above the $1,879 resistance and a bearish setup triggered by a decline through $1,786.
Earlier, analysts noted that Ethereum continued to display relative strength, supported by steady institutional inflows and ongoing accumulation by large holders, even as the broader cryptocurrency market showed limited momentum. The current shift to deeply oversold technical conditions despite robust ETF inflows suggests traders should closely monitor for a potential breakdown below $1,786, which could trigger a new leg lower if selling pressure persists.


Latest Ethereum News







-
 Afghanistan
-
 Albania
-
 Algeria
-
 Angola
-
 Argentina
-
 Armenia
-
 Australia
-
 Austria
-
 Azerbaijan
-
 Bahamas
-
 Bahrain
-
 Bangladesh
-
 Belarus
-
 Belgium
-
 Bolivia
-
 Botswana
-
 Brazil
-
 Brunei
-
 Bulgaria
-
 Cambodia
-
 Cameroon
-
 Canada
-
 Chile
Chile
-
 China
China
-
 Colombia
-
 Congo
Congo
-
 Costa Rica
-
 Cote d'Ivoire
-
 Croatia
-
 Cuba
Cuba
-
 Cyprus
-
 Czechia
-
 DR Congo
-
 Denmark
-
 Dominican Republic
-
 Ecuador
-
 Egypt
Egypt
-
 El Salvador
-
 Estonia
-
 Eswatini
-
 Ethiopia
-
 Finland
-
 France
-
 Georgia
-
 Germany
-
 Ghana
Ghana
-
 Greece
-
 Haiti
Haiti
-
 Hong Kong
-
 Hungary
-
 India
India
-
 Indonesia
-
 Iran, Islamic republic
-
 Iraq
Iraq
-
 Ireland
-
 Israel
-
 Italy
Italy
-
 Jamaica
-
 Japan
Japan
-
 Jordan
-
 Kazakhstan
-
 Kenya
Kenya
-
 Korea
Korea
-
 Kuwait
-
 Kyrgyzstan
-
 Laos
Laos
-
 Latvia
-
 Lebanon
-
 Lesotho
-
 Libya
Libya
-
 Lithuania
-
 Luxembourg
-
 Madagascar
-
 Malaysia
-
 Malta
Malta
-
 Mauritius
-
 Mexico
-
 Moldova
-
 Mongolia
-
 Montenegro
-
 Morocco
-
 Mozambique
-
 Myanmar
-
 Namibia
-
 Nepal
Nepal
-
 Netherlands
-
 New Zealand
-
 Nigeria
-
 North Macedonia
-
 Norway
-
 Oman
Oman
-
 Pakistan
-
 Palestine
-
 Panama
-
 Papua New Guinea
-
 Paraguay
-
 Peru
Peru
-
 Philippines
-
 Poland
-
 Portugal
-
 Puerto Rico
-
 Qatar
Qatar
-
 Reunion
-
 Romania
-
 Rwanda
-
 Saudi Arabia
-
 Serbia
-
 Singapore
-
 Slovakia
-
 Slovenia
-
 Somalia
-
 South Africa
-
 Spain
Spain
-
 Sri Lanka
-
 Sweden
-
 Switzerland
-
 Syria
Syria
-
 Taiwan
-
 Tajikistan
-
 Tanzania
-
 Thailand
-
 Trinidad and Tobago
-
 Tunisia
-
 Turkey
-
 UAE
UAE
-
 Uganda
-
 Ukraine
-
 United Kingdom
-
United States
-
 Uruguay
-
 Uzbekistan
-
 Venezuela
-
 Vietnam
-
 Yemen
Yemen
-
 Zambia
-
 Zimbabwe
- Forex
- Crypto











