
Why is XRP flat today? Weak momentum and resistance test cap upside.

XRP (XRP) is trading at $1.088, with a slight gain for the day. The asset currently sits above its key short-term moving average but remains beneath higher timeframe averages.
 1.1083
1.1302
1.1083
1.1302
Highlights
- Gallagher Capital Management’s $961,126 investment in the Canary XRP ETF signals notable institutional participation in XRP-related products.
- Ripple Payments Europe’s MiCA registration and resolution of SEC litigation support a strengthened regulatory footing and ecosystem expansion for XRP.
- XRP trades in a narrow $1.0708–$1.1052 range with bearish momentum, as technical indicators favor further near-term downside.
Institutional inflows rise as regulatory advances reshape XRP landscape
Gallagher Capital Management LLC’s filing of its Q2 2026 SEC Form 13F, disclosing a $961,126 position in the Canary XRP ETF, evidences tangible institutional engagement with XRP products, a development noted by Tronweekly. This occurs alongside Ripple Payments Europe being added to the ESMA MiCA registration list, which facilitates regulatory access to the EU’s evolving compliance environment, according to Coincu. Ripple’s recent approval for a Crypto asset services license under MiCA, together with the resolution of its litigation with the U.S. SEC and continued expansion of the XRP Ledger into stablecoins and tokenization, rounds out a multifaceted backdrop of regulatory and ecosystem progress for XRP.
Mixed momentum signals as key averages define trading boundaries
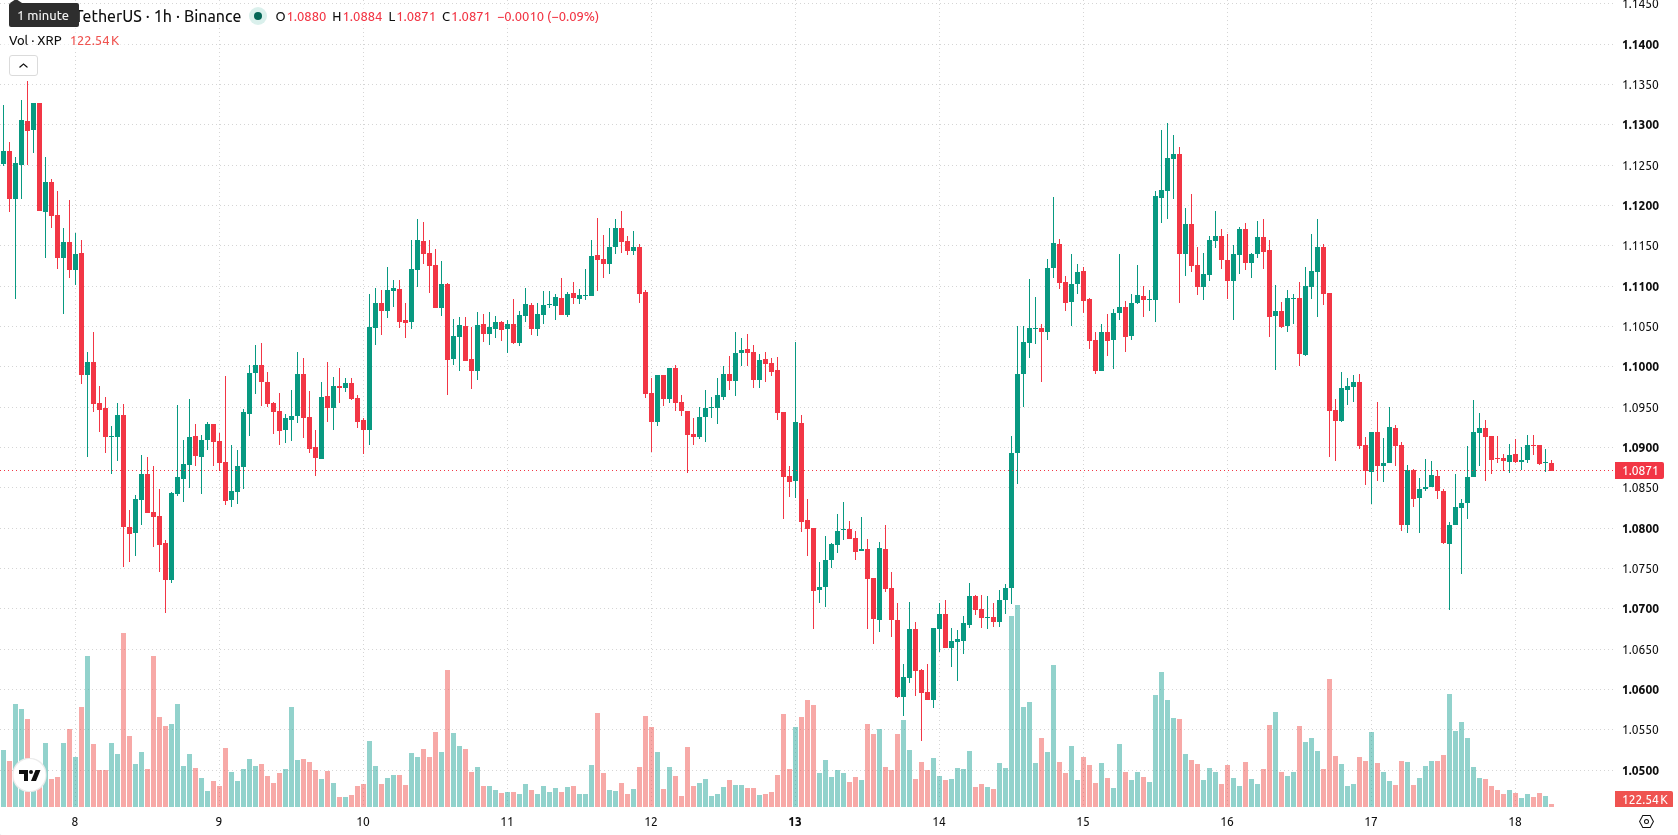
The 20-day moving average provides near-term support at $1.0871, while upside is capped by resistance at the 50-day moving average at $1.0945 and the 200-day moving average higher at $1.4325. The Ichimoku Kijun sits at $1.0828, forming an immediate technical support. Momentum indicators present a mixed picture: the Moving Average Convergence Divergence (MACD) and Average Directional Index (ADX) both present a sell bias. The Relative Strength Index (RSI) is at 47.56, implying weak momentum, while the Stochastic RSI indicates strong selling pressure. The Commodity Channel Index (CCI) is neutral, signaling the absence of overbought or oversold conditions. Meanwhile, Bull/Bear Power reflects some buyer activity in intraday dynamics, and the Awesome Oscillator hints at buying bias, underscoring short-term indecision among traders.
Sideways price action likely as volatility remains subdued
In the short term, XRP is likely to consolidate within a corridor of $1.0708 to $1.1052, reflecting current low volatility conditions. An upward break above $1.1052 would suggest a shift toward a bullish scenario, while a decline below the $1.0708 support could accelerate further downside. The most probable outcome is continued sideways movement within this volatility band over the next several sessions, with a low probability assigned to a meaningful reversal.
Earlier, analysts noted that XRP was experiencing persistent downside pressure, with bearish technical indicators dominating the outlook. Recent developments—including expanded institutional engagement and regulatory advances—add a constructive dimension, but traders should closely monitor for a decisive move beyond the current period of low volatility, as any breakout above or below the consolidation range could establish the next meaningful trend.








-
 Afghanistan
-
 Albania
-
 Algeria
-
 Angola
-
 Argentina
-
 Armenia
-
 Australia
-
 Austria
-
 Azerbaijan
-
 Bahamas
-
 Bahrain
-
 Bangladesh
-
 Belarus
-
 Belgium
-
 Bolivia
-
 Botswana
-
 Brazil
-
 Brunei
-
 Bulgaria
-
 Cambodia
-
 Cameroon
-
 Canada
-
 Chile
Chile
-
 China
China
-
 Colombia
-
 Congo
Congo
-
 Costa Rica
-
 Cote d'Ivoire
-
 Croatia
-
 Cuba
Cuba
-
 Cyprus
-
 Czechia
-
 DR Congo
-
 Denmark
-
 Dominican Republic
-
 Ecuador
-
 Egypt
Egypt
-
 El Salvador
-
 Estonia
-
 Eswatini
-
 Ethiopia
-
 Finland
-
 France
-
 Georgia
-
 Germany
-
 Ghana
Ghana
-
 Greece
-
 Haiti
Haiti
-
 Hong Kong
-
 Hungary
-
 India
India
-
 Indonesia
-
 Iran, Islamic republic
-
 Iraq
Iraq
-
 Ireland
-
 Israel
-
 Italy
Italy
-
 Jamaica
-
 Japan
Japan
-
 Jordan
-
 Kazakhstan
-
 Kenya
Kenya
-
 Korea
Korea
-
 Kuwait
-
 Kyrgyzstan
-
 Laos
Laos
-
 Latvia
-
 Lebanon
-
 Lesotho
-
 Libya
Libya
-
 Lithuania
-
 Luxembourg
-
 Madagascar
-
 Malaysia
-
 Malta
Malta
-
 Mauritius
-
 Mexico
-
 Moldova
-
 Mongolia
-
 Montenegro
-
 Morocco
-
 Mozambique
-
 Myanmar
-
 Namibia
-
 Nepal
Nepal
-
 Netherlands
-
 New Zealand
-
 Nigeria
-
 North Macedonia
-
 Norway
-
 Oman
Oman
-
 Pakistan
-
 Palestine
-
 Panama
-
 Papua New Guinea
-
 Paraguay
-
 Peru
Peru
-
 Philippines
-
 Poland
-
 Portugal
-
 Puerto Rico
-
 Qatar
Qatar
-
 Reunion
-
 Romania
-
 Rwanda
-
 Saudi Arabia
-
 Serbia
-
 Singapore
-
 Slovakia
-
 Slovenia
-
 Somalia
-
 South Africa
-
 Spain
Spain
-
 Sri Lanka
-
 Sweden
-
 Switzerland
-
 Syria
Syria
-
 Taiwan
-
 Tajikistan
-
 Tanzania
-
 Thailand
-
 Trinidad and Tobago
-
 Tunisia
-
 Turkey
-
 UAE
UAE
-
 Uganda
-
 Ukraine
-
 United Kingdom
-
United States
-
 Uruguay
-
 Uzbekistan
-
 Venezuela
-
 Vietnam
-
 Yemen
Yemen
-
 Zambia
-
 Zimbabwe
- Forex
- Crypto











