

$7.32 resistance test: Can Ethereum Classic break out further?

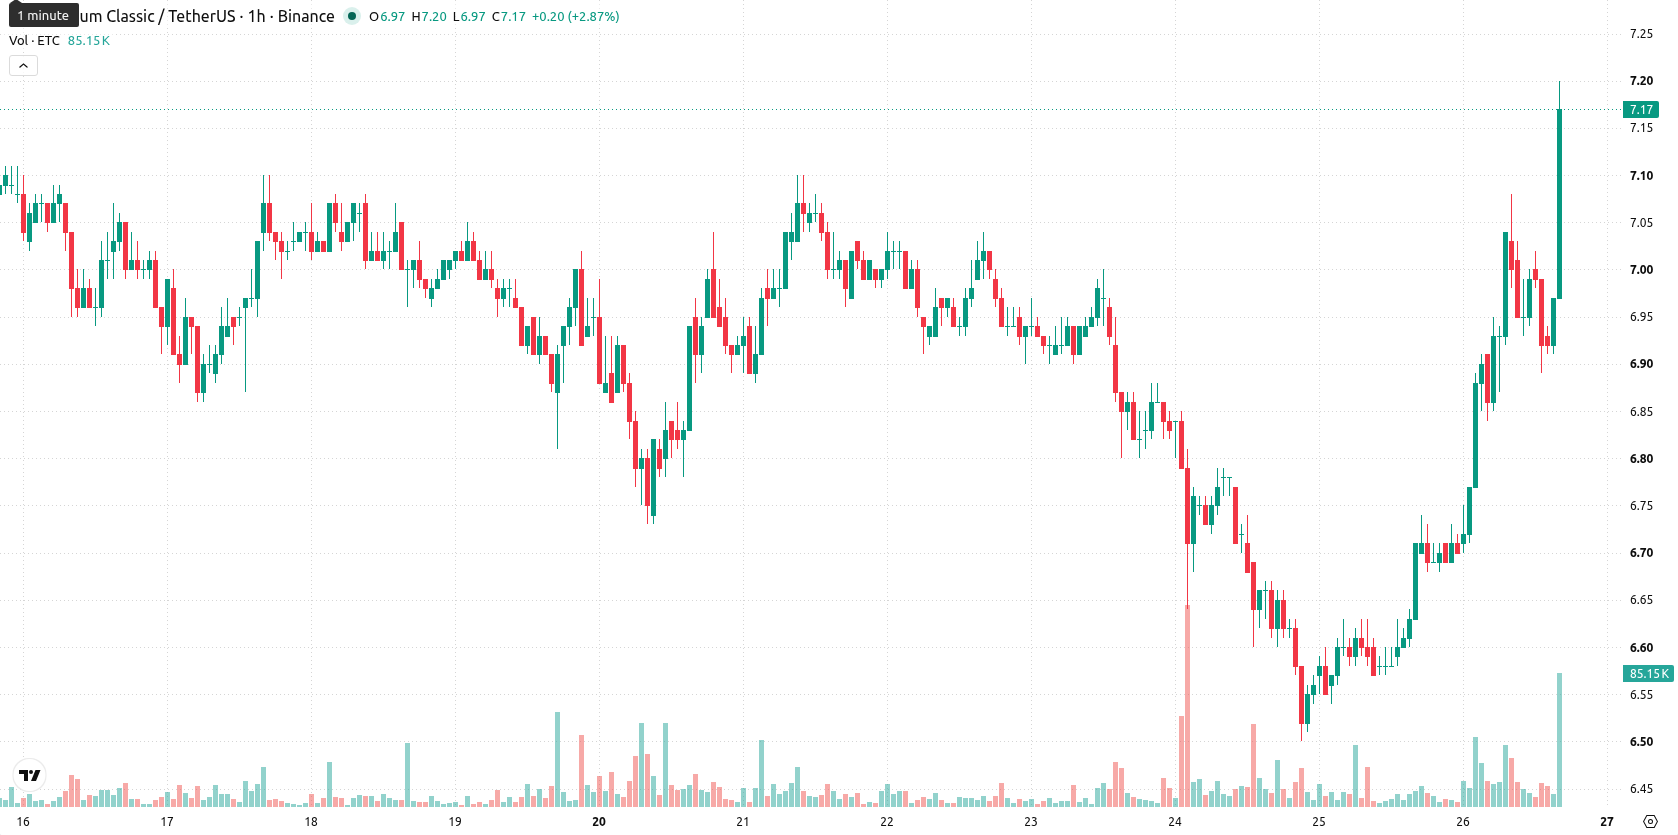
Ethereum Classic (ETC) is trading at $7.19, climbing 7.47% on the day. The asset sits near session highs and has moved above its key short-term moving averages, reflecting robust intraday momentum.
 5.5
6.300000
Highlights
- ETC/USD shows strong short-term bullish momentum, trading above near-term averages but remains below longer-term resistance.
- Momentum indicators signal persistent upside bias, although mixed oscillator readings suggest possible short-term exhaustion.
- Price is expected to consolidate between $6.9 and $7.32 with a high probability of further upside unless support at $6.84 breaks.
Momentum divergence emerges as buyers maintain technical control
On the hourly chart, ETC trades above the MA-20 at $6.87 and the MA-50 at $6.71, while the longer-term MA-200 lags behind at $8.62. The Ichimoku Kijun level at $6.84 provides immediate support. Momentum indicators are firm: MACD and ADX remain in buy or strong buy territory. RSI reads 62.47 (Buy), Stochastic RSI is Oversold, and CCI is Neutral, showing a divergence among oscillators. Bull/Bear Power is in strong buy territory, confirming intraday dominance by buyers.
Upside breakout likely as consolidation tightens near resistance
Over the next 1–2 trading days, ETC/USD is likely to consolidate within the $6.9–$7.32 volatility band relative to current levels. Upside probability is very high, with any move above resistance likely to accelerate gains beyond the upper boundary. If the price drops below support at $6.84, further unwinding could push it toward the range lows.
Earlier, analysts noted that Ethereum Classic was trapped in a persistent bearish trend with limited prospects for a sustained reversal. The recent surge above key short-term moving averages introduces the possibility of a regime shift, making price action around the $6.84 support and $7.32 resistance crucial for traders monitoring momentum in the days ahead.






Latest Ethereum Classic (ETC) News




-
 Afghanistan
-
 Albania
-
 Algeria
-
 Angola
-
 Argentina
-
 Armenia
-
 Australia
-
 Austria
-
 Azerbaijan
-
 Bahamas
-
 Bahrain
-
 Bangladesh
-
 Belarus
-
 Belgium
-
 Bolivia
-
 Botswana
-
 Brazil
-
 Brunei
-
 Bulgaria
-
 Cambodia
-
 Cameroon
-
 Canada
-
 Chile
-
 China
-
 Colombia
-
 Congo
-
 Costa Rica
-
 Cote d'Ivoire
-
 Croatia
-
 Cuba
-
 Cyprus
-
 Czechia
-
 DR Congo
-
 Denmark
-
 Dominican Republic
-
 Ecuador
-
 Egypt
-
 El Salvador
-
 Estonia
-
 Eswatini
-
 Ethiopia
-
 Finland
-
 France
-
 Georgia
-
 Germany
-
 Ghana
-
 Greece
-
 Haiti
-
 Hong Kong
-
 Hungary
-
 India
-
 Indonesia
-
 Iran, Islamic republic
-
 Iraq
-
 Ireland
-
 Israel
-
 Italy
-
 Jamaica
-
 Japan
-
 Jordan
-
 Kazakhstan
-
 Kenya
-
 Korea
-
 Kuwait
-
 Kyrgyzstan
-
 Laos
-
 Latvia
-
 Lebanon
-
 Lesotho
-
 Libya
-
 Lithuania
-
 Luxembourg
-
 Madagascar
-
 Malaysia
-
 Malta
-
 Mauritius
-
 Mexico
-
 Moldova
-
 Mongolia
-
 Montenegro
-
 Morocco
-
 Mozambique
-
 Myanmar
-
 Namibia
-
 Nepal
-
 Netherlands
-
 New Zealand
-
 Nigeria
-
 North Macedonia
-
 Norway
-
 Oman
-
 Pakistan
-
 Palestine
-
 Panama
-
 Papua New Guinea
-
 Paraguay
-
 Peru
-
 Philippines
-
 Poland
-
 Portugal
-
 Puerto Rico
-
 Qatar
-
 Reunion
-
 Romania
-
 Rwanda
-
 Saudi Arabia
-
 Serbia
-
 Singapore
-
 Slovakia
-
 Slovenia
-
 Somalia
-
 South Africa
-
 Spain
-
 Sri Lanka
-
 Sweden
-
 Switzerland
-
 Syria
-
 Taiwan
-
 Tajikistan
-
 Tanzania
-
 Thailand
-
 Trinidad and Tobago
-
 Tunisia
-
 Turkey
-
 UAE
-
 Uganda
-
 Ukraine
-
 United Kingdom
-
United States
-
 Uruguay
-
 Uzbekistan
-
 Venezuela
-
 Vietnam
-
 Yemen
-
 Zambia
-
 Zimbabwe
- Forex
- Crypto












