

Ethereum Classic price outlook: Downward momentum persists amid seller pressure

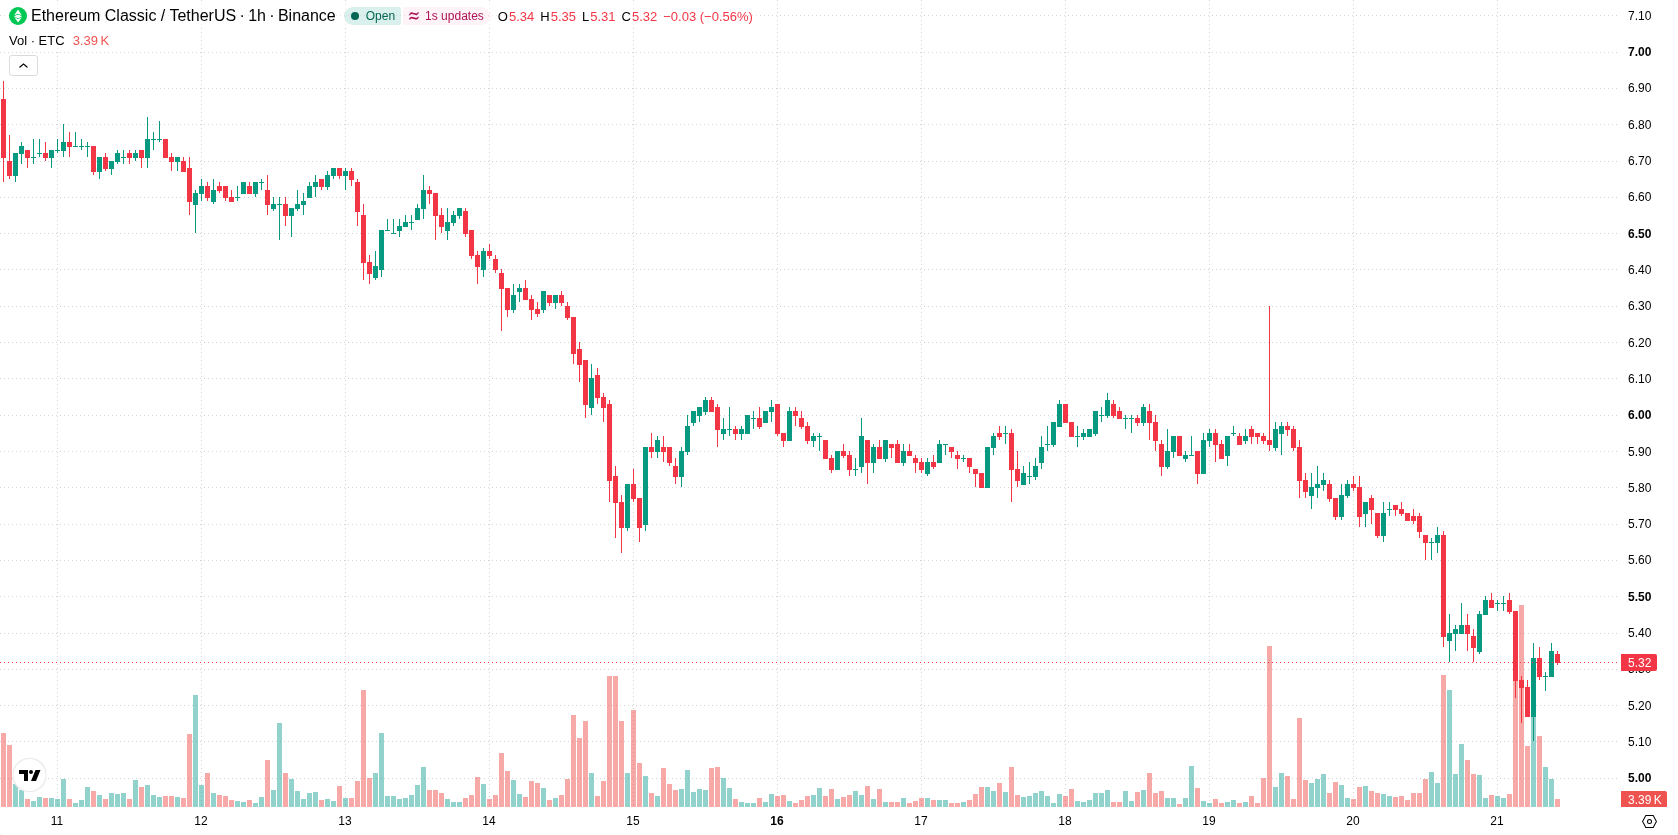
Ethereum Classic (ETC) is trading at $5.31 after falling 7.17% over the day. The price remains situated below its key moving averages, reflecting ongoing downward momentum.
 5.51
6.300000
Highlights
- ETC/USD remains under bearish pressure as it trades below key moving averages on all timeframes.
- Momentum indicators including MACD and ADX confirm a prevailing sell bias, though some oscillators give mixed short-term signals.
- Expected range for the next 2 to 3 days is $4.92 to $5.529135, with a 68% probability of further downside.
Downside bias persists amid volatility and strong bearish signals
On the technical front, ETC is trading below the H1 SMA-20 at $5.3885, the H1 SMA-50 at $5.6302, and remains well under the D1 SMA-200 at $7.57775. The Ichimoku Kijun at $5.43 currently acts as immediate resistance. Among momentum indicators, MACD is signaling a strong sell and ADX also points to a sell bias, confirming downside momentum. RSI and CCI are both neutral, while Stochastic RSI stands in the overbought zone, suggesting a possible short-term correction risk. Bull/Bear Power is negative, reflecting seller dominance on the intraday timeframe, and the Awesome Oscillator remains neutral. High intraday volatility and mixed oscillator signals, alongside prevailing bearish signals from trend and momentum indicators, indicate a downside bias tempered by potential for short-term choppy moves.
Sideways range favored as downside risks outweigh rebound hopes
Over the next 2–3 trading days, ETC is expected to trade within the $4.92 to $5.529135 volatility band relative to current levels. The probability of an upward price move is 32%, with a higher likelihood of a downward move at 68%. The base scenario points to sideways trading in the indicated range. Should price break above the immediate resistance, a short-term bullish scenario could develop, while a drop below support would open a bearish case with further downside risk.
Earlier, analysts noted that Ethereum Classic was experiencing persistent bearish momentum and downside risk. The latest analysis reaffirms this ongoing downward trend, with traders advised to closely monitor the $5.43 resistance and $4.92 support as pivotal levels that could determine the next directional move.






Latest Ethereum Classic (ETC) News




-
 Afghanistan
-
 Albania
-
 Algeria
-
 Angola
-
 Argentina
-
 Armenia
-
 Australia
-
 Austria
-
 Azerbaijan
-
 Bahamas
-
 Bahrain
-
 Bangladesh
-
 Belarus
-
 Belgium
-
 Bolivia
-
 Botswana
-
 Brazil
-
 Brunei
-
 Bulgaria
-
 Cambodia
-
 Cameroon
-
 Canada
-
 Chile
-
 China
-
 Colombia
-
 Congo
-
 Costa Rica
-
 Cote d'Ivoire
-
 Croatia
-
 Cuba
-
 Cyprus
-
 Czechia
-
 DR Congo
-
 Denmark
-
 Dominican Republic
-
 Ecuador
-
 Egypt
-
 El Salvador
-
 Estonia
-
 Eswatini
-
 Ethiopia
-
 Finland
-
 France
-
 Georgia
-
 Germany
-
 Ghana
-
 Greece
-
 Haiti
-
 Hong Kong
-
 Hungary
-
 India
-
 Indonesia
-
 Iran, Islamic republic
-
 Iraq
-
 Ireland
-
 Israel
-
 Italy
-
 Jamaica
-
 Japan
-
 Jordan
-
 Kazakhstan
-
 Kenya
-
 Korea
-
 Kuwait
-
 Kyrgyzstan
-
 Laos
-
 Latvia
-
 Lebanon
-
 Lesotho
-
 Libya
-
 Lithuania
-
 Luxembourg
-
 Madagascar
-
 Malaysia
-
 Malta
-
 Mauritius
-
 Mexico
-
 Moldova
-
 Mongolia
-
 Montenegro
-
 Morocco
-
 Mozambique
-
 Myanmar
-
 Namibia
-
 Nepal
-
 Netherlands
-
 New Zealand
-
 Nigeria
-
 North Macedonia
-
 Norway
-
 Oman
-
 Pakistan
-
 Palestine
-
 Panama
-
 Papua New Guinea
-
 Paraguay
-
 Peru
-
 Philippines
-
 Poland
-
 Portugal
-
 Puerto Rico
-
 Qatar
-
 Reunion
-
 Romania
-
 Rwanda
-
 Saudi Arabia
-
 Serbia
-
 Singapore
-
 Slovakia
-
 Slovenia
-
 Somalia
-
 South Africa
-
 Spain
-
 Sri Lanka
-
 Sweden
-
 Switzerland
-
 Syria
-
 Taiwan
-
 Tajikistan
-
 Tanzania
-
 Thailand
-
 Trinidad and Tobago
-
 Tunisia
-
 Turkey
-
 UAE
-
 Uganda
-
 Ukraine
-
 United Kingdom
-
United States
-
 Uruguay
-
 Uzbekistan
-
 Venezuela
-
 Vietnam
-
 Yemen
-
 Zambia
-
 Zimbabwe
- Forex
- Crypto












