

Arbitrum weekly outlook: Can ARB hold above $0.0765 support with downside pressure intensifying?

Institutional flows have kept Arbitrum (ARB) in the spotlight this week, with the asset trading around $0.08 after falling more than 10% over the past seven days. The recent move has put key support levels into focus, as market participants watch for signs of stabilization or further downside. The coming week will center on whether institutional developments can shift sentiment and ease the pressure seen after the sharp decline.
 0.1952
0.2031
0.1952
0.2031
Highlights
- Arbitrum has declined 10.5% over the past week, closing near its weekly lows and under persistent selling pressure.
- The token consistently trades below major moving averages, confirming a sustained bearish structure with volatility remaining elevated.
- Technical signals show oversold conditions forming near $0.0765 support, with projected trading range of $0.0724 to $0.0807 and a downward consolidation bias.
Robinhood Chain integration and DAO revenues drive positive sentiment this week
Arbitrum has gained attention following its integration with Robinhood Chain, which is built on the Arbitrum Orbit stack. According to crypto.news and MarketScreener, Robinhood Chain channels 10% of its net revenue to the Arbitrum DAO, with approximately $2 million already received and over 100 million transactions processed since July 1. Additional developments include a governance adjustment by the Arbitrum Security Council to fix delegated voting records and a software upgrade enabling multi-VM smart contracts, as reported by Bitcoinist and thecurrencyanalytics.com.
Technical momentum shifts as oversold signals emerge amid elevated volatility
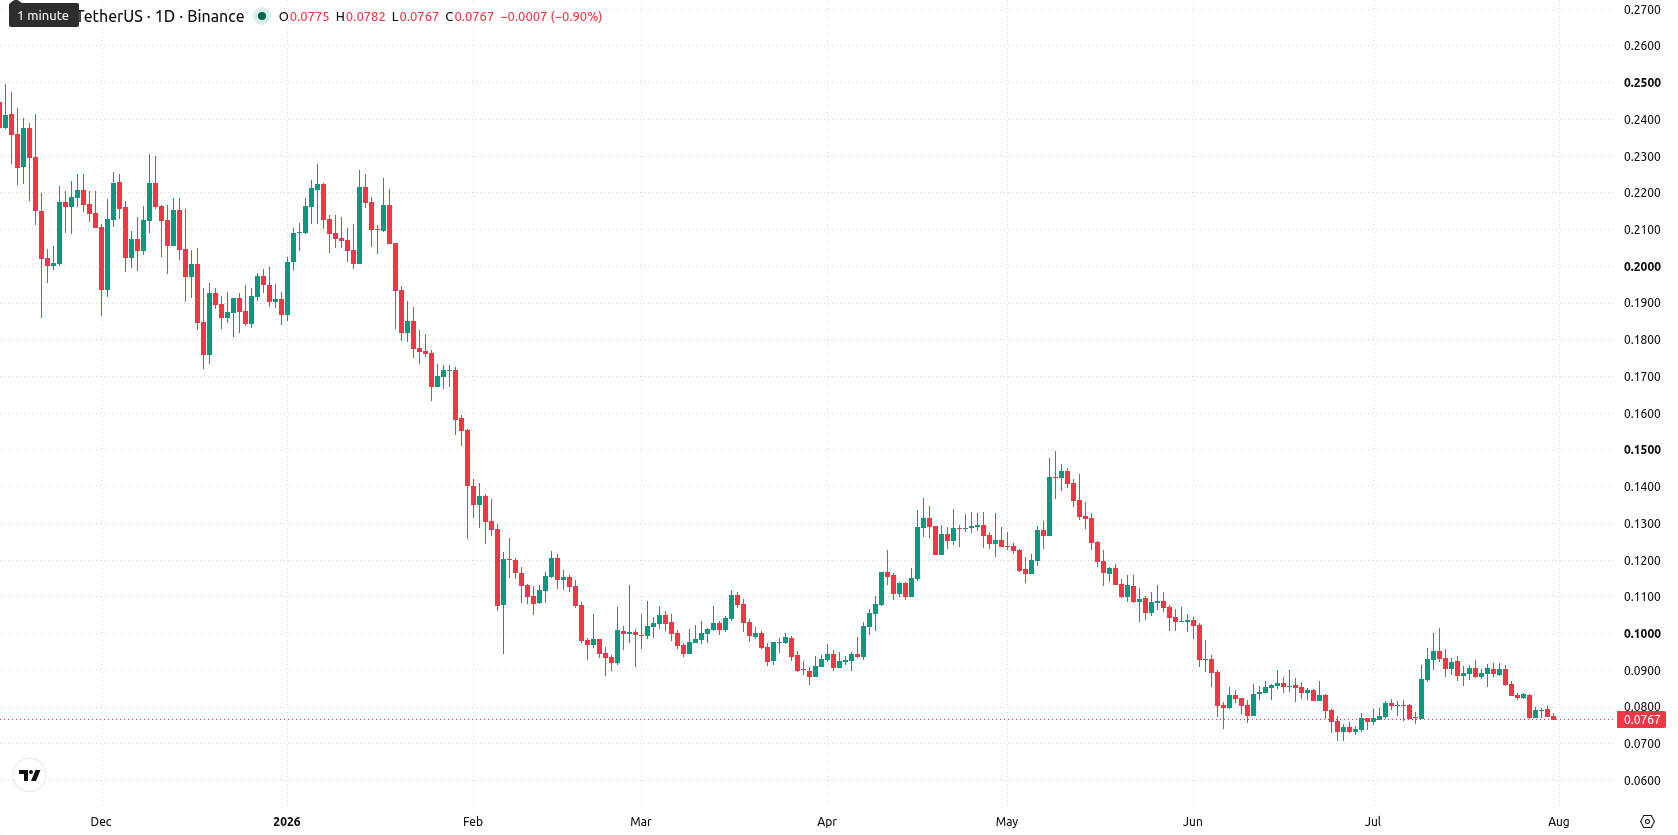
The daily chart shows a sharp move lower without a sustained trend, as volatility spiked to 9.41%. RSI is at 38.2349, approaching oversold territory, while CCI and Stoch RSI have already entered their respective oversold zones, signaling increasingly stretched downside conditions. Nearest support sits at $0.0765, just below current levels, with resistance defined by the MA-50 at $0.0833 and the Ichimoku Kijun at $0.0883. These factors point to heavy downward pressure, but a potential for near-term exhaustion if buyers step in.
Downward bias likely as support retest and breakout risks shape outlook
Over the next 7 days, Arbitrum is forecast to trade between $0.0724 and $0.0807, with a very low probability of an increase and a very high probability of a decrease. The base case is continued consolidation near support, with a clear downward bias. A close above resistance at $0.0833 would open the door for a bullish retracement, while a break below $0.0765 would confirm further downside toward the lower end of the expected range.
Earlier, analysts noted that Arbitrum was entrenched in a bearish trend amid persistent downside momentum and oversold technical conditions. With institutional developments and ongoing ecosystem upgrades yet to shift sentiment, traders should closely monitor for signs of reversal near $0.0765 as a break below this level would confirm renewed downside risk in the week ahead.










-
 Afghanistan
-
 Albania
-
 Algeria
-
 Angola
-
 Argentina
-
 Armenia
-
 Australia
-
 Austria
-
 Azerbaijan
-
 Bahamas
-
 Bahrain
-
 Bangladesh
-
 Belarus
-
 Belgium
-
 Bolivia
-
 Botswana
-
 Brazil
-
 Brunei
-
 Bulgaria
-
 Cambodia
-
 Cameroon
-
 Canada
-
 Chile
Chile
-
 China
China
-
 Colombia
-
 Congo
Congo
-
 Costa Rica
-
 Cote d'Ivoire
-
 Croatia
-
 Cuba
Cuba
-
 Cyprus
-
 Czechia
-
 DR Congo
-
 Denmark
-
 Dominican Republic
-
 Ecuador
-
 Egypt
Egypt
-
 El Salvador
-
 Estonia
-
 Eswatini
-
 Ethiopia
-
 Finland
-
 France
-
 Georgia
-
 Germany
-
 Ghana
Ghana
-
 Greece
-
 Haiti
Haiti
-
 Hong Kong
-
 Hungary
-
 India
India
-
 Indonesia
-
 Iran, Islamic republic
-
 Iraq
Iraq
-
 Ireland
-
 Israel
-
 Italy
Italy
-
 Jamaica
-
 Japan
Japan
-
 Jordan
-
 Kazakhstan
-
 Kenya
Kenya
-
 Korea
Korea
-
 Kuwait
-
 Kyrgyzstan
-
 Laos
Laos
-
 Latvia
-
 Lebanon
-
 Lesotho
-
 Libya
Libya
-
 Lithuania
-
 Luxembourg
-
 Madagascar
-
 Malaysia
-
 Malta
Malta
-
 Mauritius
-
 Mexico
-
 Moldova
-
 Mongolia
-
 Montenegro
-
 Morocco
-
 Mozambique
-
 Myanmar
-
 Namibia
-
 Nepal
Nepal
-
 Netherlands
-
 New Zealand
-
 Nigeria
-
 North Macedonia
-
 Norway
-
 Oman
Oman
-
 Pakistan
-
 Palestine
-
 Panama
-
 Papua New Guinea
-
 Paraguay
-
 Peru
Peru
-
 Philippines
-
 Poland
-
 Portugal
-
 Puerto Rico
-
 Qatar
Qatar
-
 Reunion
-
 Romania
-
 Rwanda
-
 Saudi Arabia
-
 Serbia
-
 Singapore
-
 Slovakia
-
 Slovenia
-
 Somalia
-
 South Africa
-
 Spain
Spain
-
 Sri Lanka
-
 Sweden
-
 Switzerland
-
 Syria
Syria
-
 Taiwan
-
 Tajikistan
-
 Tanzania
-
 Thailand
-
 Trinidad and Tobago
-
 Tunisia
-
 Turkey
-
 UAE
UAE
-
 Uganda
-
 Ukraine
-
 United Kingdom
-
United States
-
 Uruguay
-
 Uzbekistan
-
 Venezuela
-
 Vietnam
-
 Yemen
Yemen
-
 Zambia
-
 Zimbabwe
- Forex
- Crypto












