

Arbitrum support comes into focus after a stretched decline: weekly analysis

Arbitrum (ARB) is hovering near $0.14 after a steep pullback of around 15% over the past week, as sellers pressed prices sharply lower. The daily chart highlights dominant bearish momentum and oversold signals, bringing support levels into sharper focus. Market participants will be closely watching whether this stretch gives way to stabilization or further downward pressure in the days ahead.
 0.1459
0.1880
Highlights
- Arbitrum fell 14.83% over the past week and now trades below short-term moving averages, indicating a weak near-term structure.
- Bearish momentum persists with the MACD generating a sell signal and daily chart oscillators showing oversold conditions, suggesting a risk of short-term rebound.
- Arbitrum is expected to consolidate between $0.1174 and $0.1665 in the coming week, with a 78% probability of further decline if support at $0.1416 breaks.
Stablecoin DEX volume growth drives traction amid governance shake-up
Arbitrum recorded significant traction in tokenized real-world assets, with approximately $1.09 billion hosted and a 12% increase in holders over the past month, according to AltcoinBuzz. In governance news, GMX will dissolve its Governance Committee and transfer duties to internal contributors as reported by TokenPost. Additional developments include Arbitrum leading all blockchains in stablecoin DEX volume growth and surpassing $400,000 in priority fee revenue, setting an active stage for the coming week (sources: TokenPost, ChainCatcher).
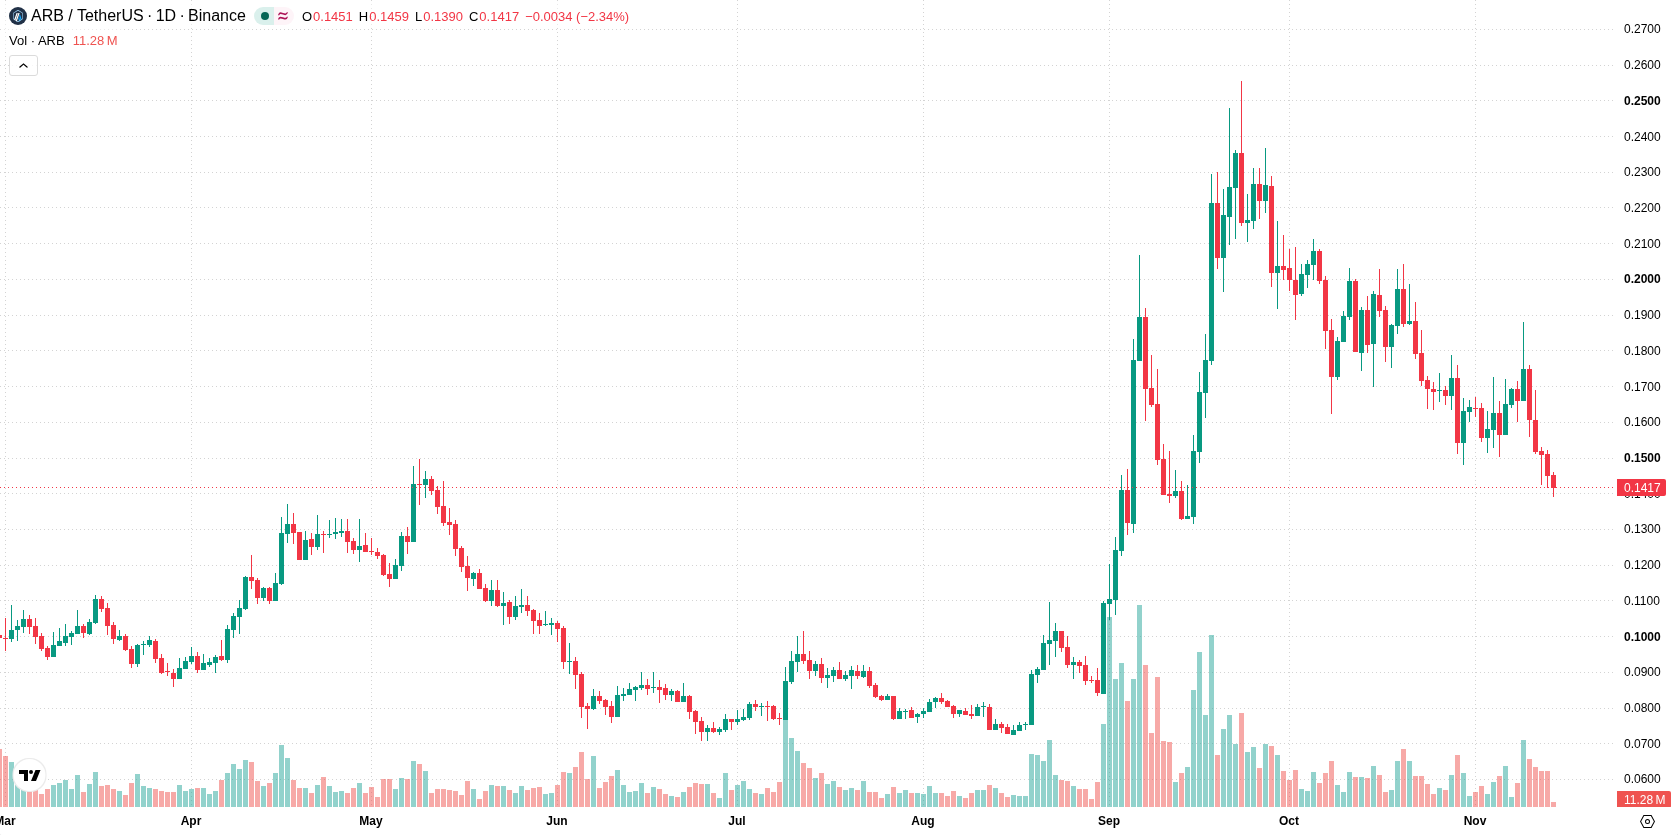
Bearish signals intensify as volatility and oversold RSI shape near-term risks
On the daily chart, the prevailing setup is defined by a sharp move lower without a sustained trend, with volatility over the past seven days coming in at 32.77%. Bearish momentum dominates, as reflected by the MACD generating a Sell signal and the Stochastic RSI registering an oversold reading at 0, indicating potential selling exhaustion and possible rebound risk. The nearest support is $0.1416, which is being tested, while resistance is seen at the 20-day moving average of $0.1619 and the Ichimoku Kijun at $0.1729, acting as further barriers to the upside.
Consolidation bias holds for next week pending break of key support or resistance
Over the coming week, the expected range is $0.1174 to $0.1665, with a 22% probability of an increase and a 78% chance of a decrease. The base case is a consolidation inside these levels, with sellers remaining in control below $0.1619. Breaking above resistance at $0.1619 would shift focus to further recovery attempts. A close below support at $0.1416 could open up a deeper move toward $0.1174.
Earlier, analysts noted that Arbitrum was under persistent selling pressure, with technical signals indicating continued defensive momentum despite steady ecosystem progress. The current analysis reinforces this bearish backdrop and highlights $0.1416 as a crucial support level, with a close below it potentially triggering further downside toward $0.1174.










-
 Afghanistan
-
 Albania
-
 Algeria
-
 Angola
-
 Argentina
-
 Armenia
-
 Australia
-
 Austria
-
 Azerbaijan
-
 Bahamas
-
 Bahrain
-
 Bangladesh
-
 Belarus
-
 Belgium
-
 Bolivia
-
 Botswana
-
 Brazil
-
 Brunei
-
 Bulgaria
-
 Cambodia
-
 Cameroon
-
 Canada
-
 Chile
-
 China
-
 Colombia
-
 Congo
-
 Costa Rica
-
 Cote d'Ivoire
-
 Croatia
-
 Cuba
-
 Cyprus
-
 Czechia
-
 DR Congo
-
 Denmark
-
 Dominican Republic
-
 Ecuador
-
 Egypt
-
 El Salvador
-
 Estonia
-
 Eswatini
-
 Ethiopia
-
 Finland
-
 France
-
 Georgia
-
 Germany
-
 Ghana
-
 Greece
-
 Haiti
-
 Hong Kong
-
 Hungary
-
 India
-
 Indonesia
-
 Iran, Islamic republic
-
 Iraq
-
 Ireland
-
 Israel
-
 Italy
-
 Jamaica
-
 Japan
-
 Jordan
-
 Kazakhstan
-
 Kenya
-
 Korea
-
 Kuwait
-
 Kyrgyzstan
-
 Laos
-
 Latvia
-
 Lebanon
-
 Lesotho
-
 Libya
-
 Lithuania
-
 Luxembourg
-
 Madagascar
-
 Malaysia
-
 Malta
-
 Mauritius
-
 Mexico
-
 Moldova
-
 Mongolia
-
 Montenegro
-
 Morocco
-
 Mozambique
-
 Myanmar
-
 Namibia
-
 Nepal
-
 Netherlands
-
 New Zealand
-
 Nigeria
-
 North Macedonia
-
 Norway
-
 Oman
-
 Pakistan
-
 Palestine
-
 Panama
-
 Papua New Guinea
-
 Paraguay
-
 Peru
-
 Philippines
-
 Poland
-
 Portugal
-
 Puerto Rico
-
 Qatar
-
 Reunion
-
 Romania
-
 Rwanda
-
 Saudi Arabia
-
 Serbia
-
 Singapore
-
 Slovakia
-
 Slovenia
-
 Somalia
-
 South Africa
-
 Spain
-
 Sri Lanka
-
 Sweden
-
 Switzerland
-
 Syria
-
 Taiwan
-
 Tajikistan
-
 Tanzania
-
 Thailand
-
 Trinidad and Tobago
-
 Tunisia
-
 Turkey
-
 UAE
-
 Uganda
-
 Ukraine
-
 United Kingdom
-
United States
-
 Uruguay
-
 Uzbekistan
-
 Venezuela
-
 Vietnam
-
 Yemen
-
 Zambia
-
 Zimbabwe
- Forex
- Crypto












