

Will Arbitrum extend losses amid ongoing weak momentum?

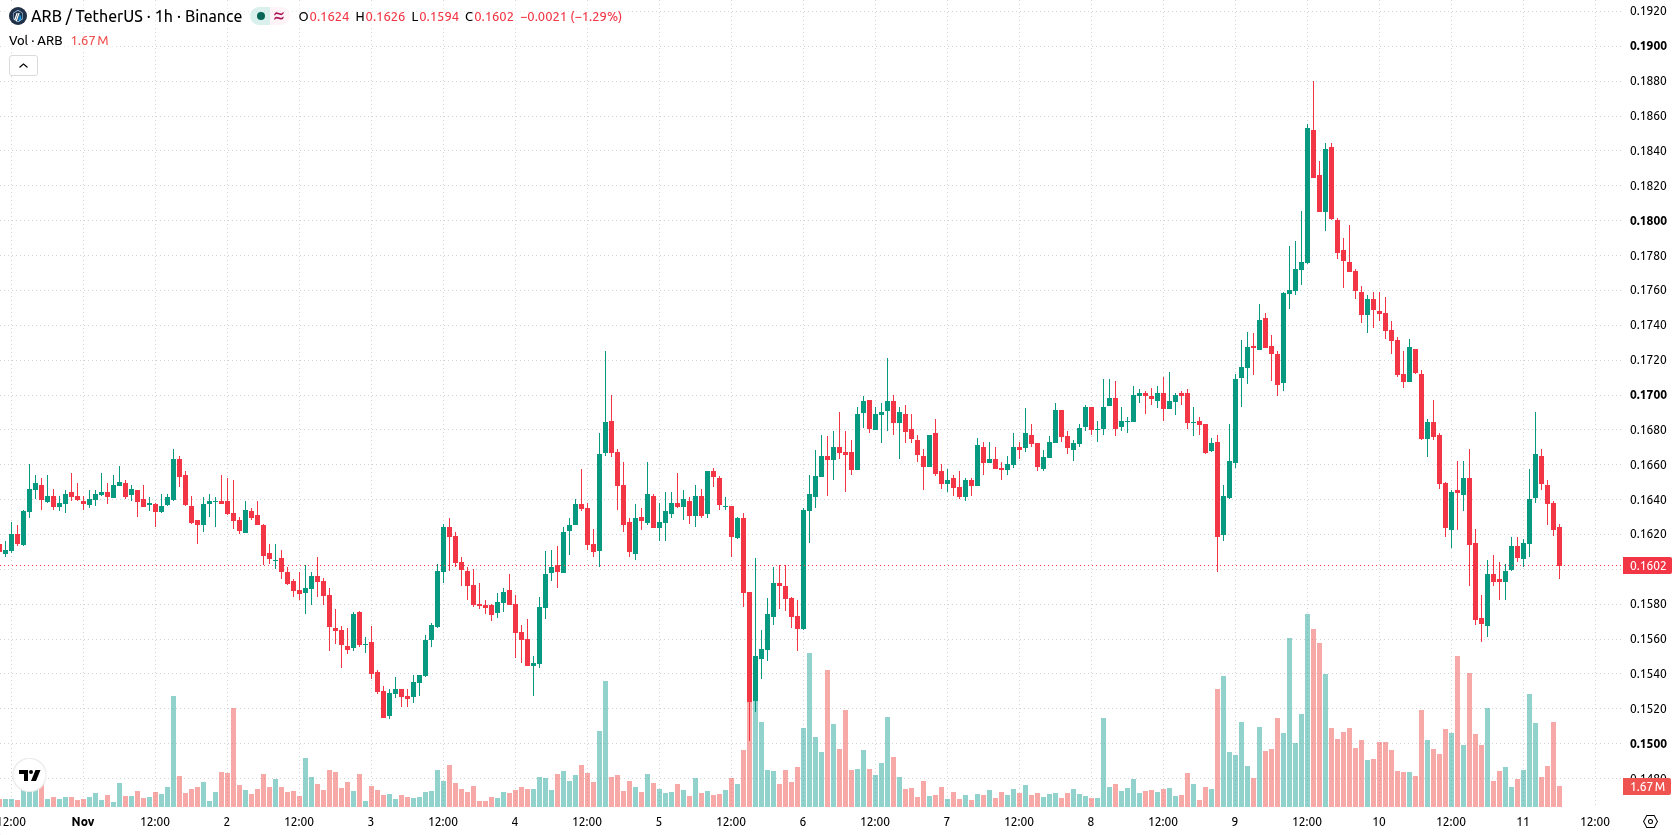
Arbitrum (ARB) is trading at $0.16, posting a 7.14% drop for the day amid noticeable volatility. The price is currently positioned below its key short- and medium-term moving averages, while still holding above the longer-term average.
 0.1374
0.1880
Highlights
- Arbitrum introduced a mentorship program with Robinhood Chain, offering support and incentives to early-stage crypto projects focused on product, distribution, and liquidity.
- Arbitrum One generated over $400,000 in priority fee revenue from 35 million PGA transactions, showing robust demand for block space and ecosystem utilization.
- ARB/USD trades below key moving averages with high intraday volatility, projecting a high probability of a move toward the $0.1515 to $0.1685 range over the next several days.
Ecosystem expansion and strong network activity counter broad selling pressure
Arbitrum has launched a mentorship program with Robinhood Chain to support early-stage crypto teams in areas such as product strategy, distribution, and liquidity, offering opportunities to compete in Demo Day for prizes, according to Coinfomania. This initiative seeks to expand the ecosystem by providing resources and incentives for new project development, potentially enhancing future on-chain activity. In addition, Arbitrum One recorded over $400,000 in priority fee revenue from 35 million PGA transactions, confirming strong demand for block space, as reported by Chaincatcher. The AI smart contract project GenLayer also completed its testnet migration to the Arbitrum Nitro stack, further diversifying the platform's decentralized application offerings, according to Techflowpost, though price action has remained under broader selling pressure.
Conflicting momentum indicators as key averages and supports converge
On the h1 chart, ARB is positioned below its MA-20 at $0.162 and MA-50 at $0.1699, but remains above the MA-200 at $0.1244. The Ichimoku Kijun level at $0.1645 provides immediate resistance, while $0.1515 acts as the next notable support. Momentum indicators present a mixed picture: MACD is on a Strong Sell signal, while ADX signals a Buy, highlighting conflicting momentum cues. RSI, Stochastic RSI, and CCI are all in neutral zones, showing no overbought or oversold conditions. Bull/Bear Power is slightly positive at 0.0007, suggesting marginal buyer presence intraday. The Awesome Oscillator remains neutral.
Downside risk dominates as rebound odds remain limited in current range
Over the short term, ARB is likely to fluctuate within a volatility band between $0.1515 and $0.1685 based on recent price dynamics. The probability of an upward move remains very low, while the potential for further downside is high; a rebound appears unlikely in the current environment. If price breaks above resistance at $0.1645, higher levels could be targeted, but a move below support near $0.1515 would reinforce the prevailing downtrend.
Earlier, analysts noted that Arbitrum was facing persistent selling pressure and mixed momentum signals, indicating a challenging technical backdrop. The latest price action and indicator readings further reinforce this cautious outlook, with downside risk prevailing and support at $0.1515 emerging as the critical level to monitor.










-
 Afghanistan
-
 Albania
-
 Algeria
-
 Angola
-
 Argentina
-
 Armenia
-
 Australia
-
 Austria
-
 Azerbaijan
-
 Bahamas
-
 Bahrain
-
 Bangladesh
-
 Belarus
-
 Belgium
-
 Bolivia
-
 Botswana
-
 Brazil
-
 Brunei
-
 Bulgaria
-
 Cambodia
-
 Cameroon
-
 Canada
-
 Chile
-
 China
-
 Colombia
-
 Congo
-
 Costa Rica
-
 Cote d'Ivoire
-
 Croatia
-
 Cuba
-
 Cyprus
-
 Czechia
-
 DR Congo
-
 Denmark
-
 Dominican Republic
-
 Ecuador
-
 Egypt
-
 El Salvador
-
 Estonia
-
 Eswatini
-
 Ethiopia
-
 Finland
-
 France
-
 Georgia
-
 Germany
-
 Ghana
-
 Greece
-
 Haiti
-
 Hong Kong
-
 Hungary
-
 India
-
 Indonesia
-
 Iran, Islamic republic
-
 Iraq
-
 Ireland
-
 Israel
-
 Italy
-
 Jamaica
-
 Japan
-
 Jordan
-
 Kazakhstan
-
 Kenya
-
 Korea
-
 Kuwait
-
 Kyrgyzstan
-
 Laos
-
 Latvia
-
 Lebanon
-
 Lesotho
-
 Libya
-
 Lithuania
-
 Luxembourg
-
 Madagascar
-
 Malaysia
-
 Malta
-
 Mauritius
-
 Mexico
-
 Moldova
-
 Mongolia
-
 Montenegro
-
 Morocco
-
 Mozambique
-
 Myanmar
-
 Namibia
-
 Nepal
-
 Netherlands
-
 New Zealand
-
 Nigeria
-
 North Macedonia
-
 Norway
-
 Oman
-
 Pakistan
-
 Palestine
-
 Panama
-
 Papua New Guinea
-
 Paraguay
-
 Peru
-
 Philippines
-
 Poland
-
 Portugal
-
 Puerto Rico
-
 Qatar
-
 Reunion
-
 Romania
-
 Rwanda
-
 Saudi Arabia
-
 Serbia
-
 Singapore
-
 Slovakia
-
 Slovenia
-
 Somalia
-
 South Africa
-
 Spain
-
 Sri Lanka
-
 Sweden
-
 Switzerland
-
 Syria
-
 Taiwan
-
 Tajikistan
-
 Tanzania
-
 Thailand
-
 Trinidad and Tobago
-
 Tunisia
-
 Turkey
-
 UAE
-
 Uganda
-
 Ukraine
-
 United Kingdom
-
United States
-
 Uruguay
-
 Uzbekistan
-
 Venezuela
-
 Vietnam
-
 Yemen
-
 Zambia
-
 Zimbabwe
- Forex
- Crypto












