

Bitcoin support test at $62,916: Technical outlook

Bitcoin (BTC) is trading at $63,453, marking a modest rise in the latest session. The asset holds above its key short- and medium-term moving averages but remains under major long-term averages.
 77892.85
81971.00
Highlights
- US spot Bitcoin ETFs recorded $265.4 million in net outflows on July 31, 2026, led by significant redemptions from BlackRock's IBIT fund.
- BlackRock’s IBIT saw $122.66 million in Bitcoin withdrawn yet maintained $46.52 billion in net assets, emphasizing ETF flows' market impact.
- BTC/USD faces mixed momentum signals and overbought readings, with key support at $62,916 and a projected range of $62,677 to $64,229 over the next 2–3 days.
ETF redemptions drive institutional outflows and dampen sector liquidity
US spot Bitcoin ETFs saw $265.4 million in net outflows on July 31, 2026, driven by redemptions from BlackRock’s IBIT fund, according to Cryptobriefing and News Bitcoin. The withdrawal of capital reflects subdued institutional demand and may influence overall sector liquidity, with 1,948 Bitcoin worth $122.66 million redeemed by IBIT clients on the same day as reported by Cryptobriefing. BlackRock's IBIT fund maintained $46.52 billion in net assets and held about 739,066 BTC, highlighting the scale of ETF-linked movements shaping market dynamics.
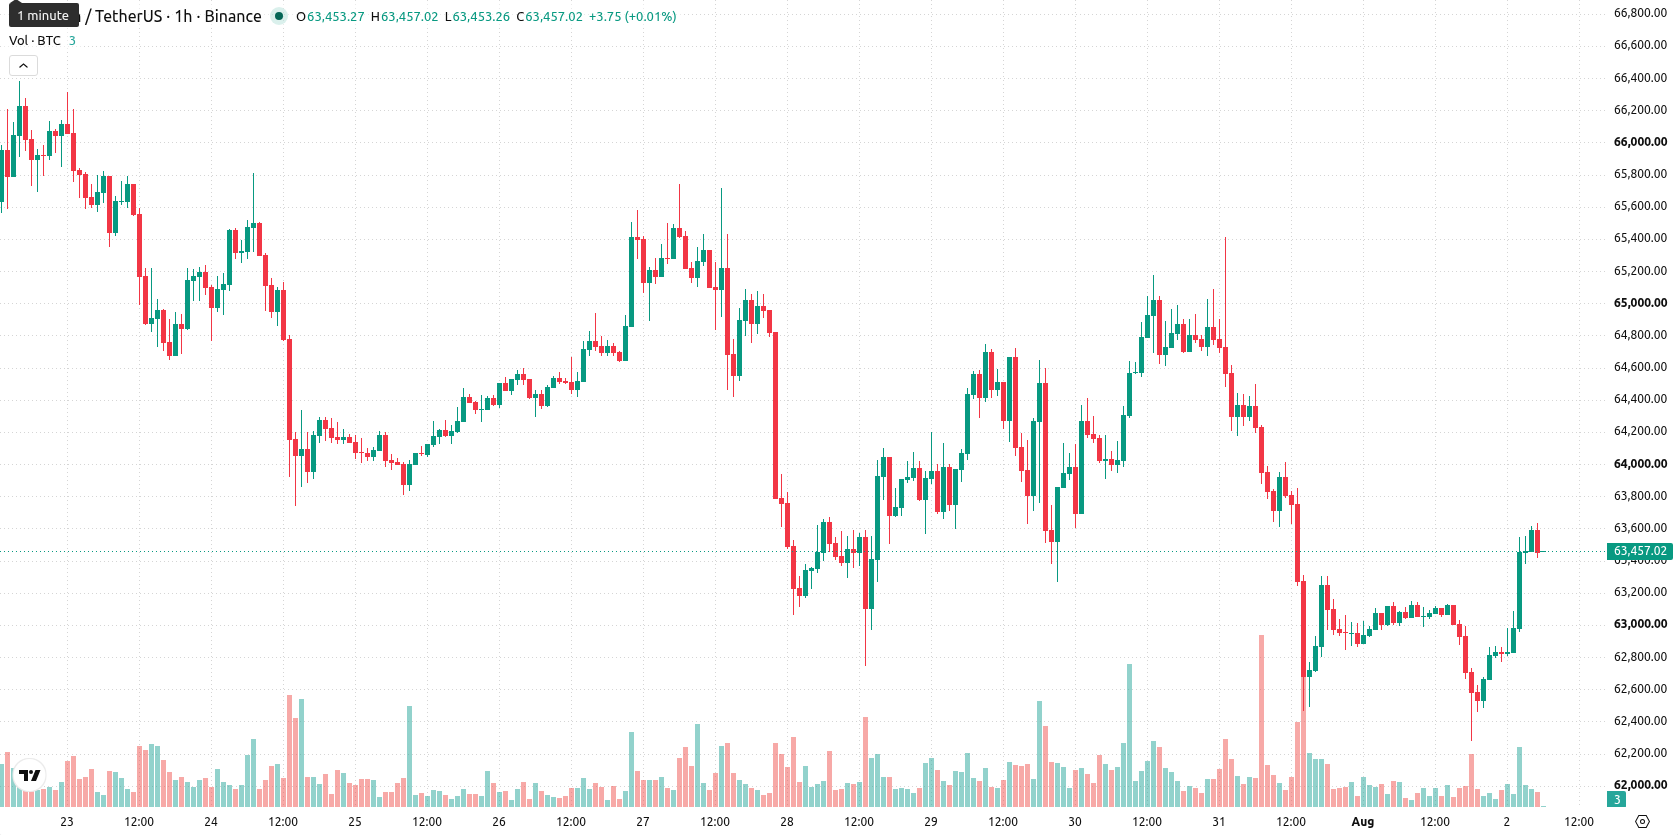
Short-term buying pressure persists amid overbought technical signals
Short-term technical levels show BTC/USD holding above the MA-20 and MA-50 on the hourly chart, while price remains under the long-term MA-200. The Ichimoku Kijun at $62,916 is the nearest support. Momentum is mixed: RSI stands at 66.49 (Buy), while both CCI and Stoch RSI are in overbought territory, suggesting stretched price action. MACD and ADX are neutral, with Bull/Bear Power highlighting buyer dominance in intraday momentum. Moderate volatility and a price gap of $216, along with a close near the session high, reinforce the prevailing short-term buying pressure, though indicator divergence and overbought signals warrant caution.
Balanced breakout risks as BTC trades within defined volatility band
In the next 2–3 trading days, BTC/USD is anticipated to fluctuate within a volatility band of $62,677 to $64,229, with probabilities balanced for both upward and downward breaks. If the price consolidates, a sideways corridor is likely to hold. A clear break above the top of the range opens a bullish scenario, while a move below support could trigger renewed selling momentum.
Earlier, analysts noted that Bitcoin remained under pressure as buyers struggled to overcome persistent resistance amid mixed institutional activity and cautious sentiment. The current rebound above short- and medium-term averages, despite notable ETF outflows, adds complexity to the outlook and suggests traders should closely monitor whether buyer momentum can sustain a breakout above the prevailing range or risk a renewed downside move if support falters.






Latest Bitcoin News





-
 Afghanistan
-
 Albania
-
 Algeria
-
 Angola
-
 Argentina
-
 Armenia
-
 Australia
-
 Austria
-
 Azerbaijan
-
 Bahamas
-
 Bahrain
-
 Bangladesh
-
 Belarus
-
 Belgium
-
 Bolivia
-
 Botswana
-
 Brazil
-
 Brunei
-
 Bulgaria
-
 Cambodia
-
 Cameroon
-
 Canada
-
 Chile
-
 China
-
 Colombia
-
 Congo
-
 Costa Rica
-
 Cote d'Ivoire
-
 Croatia
-
 Cuba
-
 Cyprus
-
 Czechia
-
 DR Congo
-
 Denmark
-
 Dominican Republic
-
 Ecuador
-
 Egypt
-
 El Salvador
-
 Estonia
-
 Eswatini
-
 Ethiopia
-
 Finland
-
 France
-
 Georgia
-
 Germany
-
 Ghana
-
 Greece
-
 Haiti
-
 Hong Kong
-
 Hungary
-
 India
-
 Indonesia
-
 Iran, Islamic republic
-
 Iraq
-
 Ireland
-
 Israel
-
 Italy
-
 Jamaica
-
 Japan
-
 Jordan
-
 Kazakhstan
-
 Kenya
-
 Korea
-
 Kuwait
-
 Kyrgyzstan
-
 Laos
-
 Latvia
-
 Lebanon
-
 Lesotho
-
 Libya
-
 Lithuania
-
 Luxembourg
-
 Madagascar
-
 Malaysia
-
 Malta
-
 Mauritius
-
 Mexico
-
 Moldova
-
 Mongolia
-
 Montenegro
-
 Morocco
-
 Mozambique
-
 Myanmar
-
 Namibia
-
 Nepal
-
 Netherlands
-
 New Zealand
-
 Nigeria
-
 North Macedonia
-
 Norway
-
 Oman
-
 Pakistan
-
 Palestine
-
 Panama
-
 Papua New Guinea
-
 Paraguay
-
 Peru
-
 Philippines
-
 Poland
-
 Portugal
-
 Puerto Rico
-
 Qatar
-
 Reunion
-
 Romania
-
 Rwanda
-
 Saudi Arabia
-
 Serbia
-
 Singapore
-
 Slovakia
-
 Slovenia
-
 Somalia
-
 South Africa
-
 Spain
-
 Sri Lanka
-
 Sweden
-
 Switzerland
-
 Syria
-
 Taiwan
-
 Tajikistan
-
 Tanzania
-
 Thailand
-
 Trinidad and Tobago
-
 Tunisia
-
 Turkey
-
 UAE
-
 Uganda
-
 Ukraine
-
 United Kingdom
-
United States
-
 Uruguay
-
 Uzbekistan
-
 Venezuela
-
 Vietnam
-
 Yemen
-
 Zambia
-
 Zimbabwe
- Forex
- Crypto












