

VeChain weekly forecast: Bearish bias holds with price under key moving averages

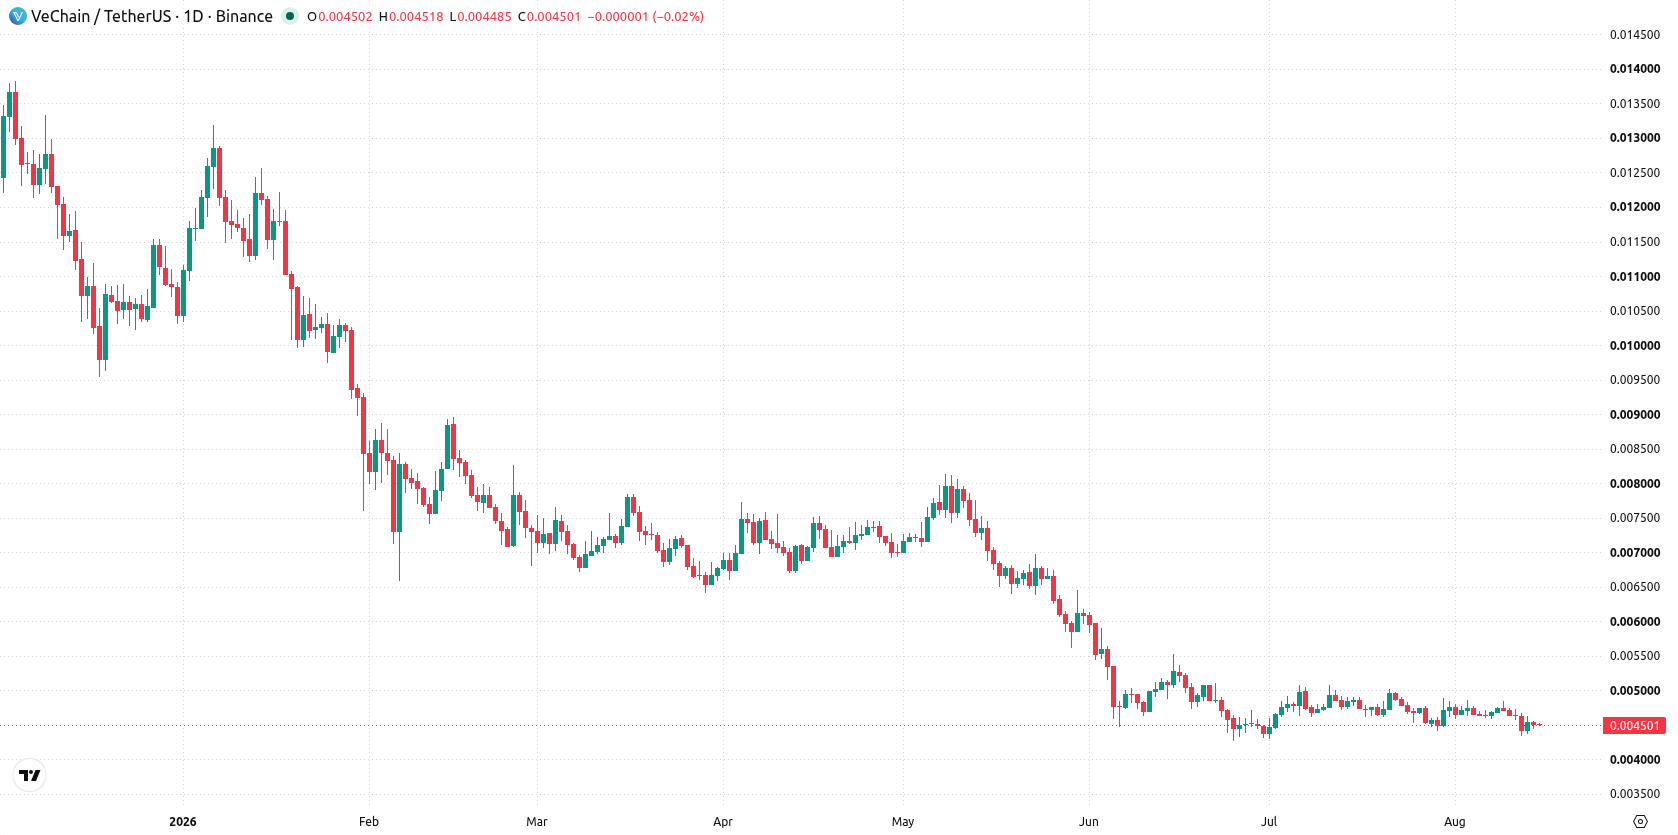
VeChain (VET) is trading around $0.0045 after slipping nearly 4% over the past week, as sellers maintain heavy pressure with technicals dipping deep into oversold territory. Market sentiment remains cautious as the setup leans strongly bearish, setting the stage for continued consolidation near support levels in the coming week.
 0.0057
0.00658300
Highlights
- VeChain trades at $0.004501, down 3.91% for the week and below short-term moving averages.
- The asset shows weak daily structure with heavy selling, confirmed by bearish indicator signals and an oversold CCI reading.
- Expected seven-day range is $0.00423695 to $0.00476504, with support at $0.00434 and strong downside probability.
Persistent structural headwinds as growth drivers lag during the week
According to DiarioBitcoin, VeChain focused on its core enterprise supply chain management and traceability initiatives this week, but reported no new adoption metrics or major developments. The protocol continues to trade significantly below its April 2021 peak and remains under all key moving averages, indicating persistent structural headwinds for VET.
Oversold momentum worsens as weekly volatility and bearish signals align
On the daily chart, the structure is weak, with price action showing a sharp move lower without a sustained trend and recent weekly volatility at 11.5%. MACD and Bull/Bear Power both lean bearish, while CCI enters the oversold zone at -140.14470713, hinting at heavy selling pressure but not yet a definitive reversal setup. Key levels are defined by support at $0.00434 and resistance at $0.0046333, with the Ichimoku Kijun at $0.004677 acting as an additional resistance ceiling. The mix of oversold momentum and pronounced downside bias sets the stage for further consolidation near the lows.
Downside risk prevails barring upside breakouts in the coming week
Over the next 7 days, the expected range is $0.00423695 to $0.00476504, with a very high probability of a decrease and a very low probability of an increase. The base case is further range-bound action near support, reflecting strong selling pressure. A sustained move above $0.0046333 could open up a squeeze toward $0.00476504, while a break below $0.00434 would reinforce the bearish bias and likely extend losses toward the lower end of the forecast range.
Earlier, analysts noted that VeChain was experiencing persistent bearish pressures and exhibiting a consolidation bias amid ongoing technical weaknesses. This outlook remains reinforced as the latest trading sees VET entrenched at lower levels, with traders advised to monitor the $0.00434 support area for signs of further downside risk or a potential shift in near-term momentum.










-
 Afghanistan
-
 Albania
-
 Algeria
-
 Angola
-
 Argentina
-
 Armenia
-
 Australia
-
 Austria
-
 Azerbaijan
-
 Bahamas
-
 Bahrain
-
 Bangladesh
-
 Belarus
-
 Belgium
-
 Bolivia
-
 Botswana
-
 Brazil
-
 Brunei
-
 Bulgaria
-
 Cambodia
-
 Cameroon
-
 Canada
-
 Chile
-
 China
-
 Colombia
-
 Congo
-
 Costa Rica
-
 Cote d'Ivoire
-
 Croatia
-
 Cuba
-
 Cyprus
-
 Czechia
-
 DR Congo
-
 Denmark
-
 Dominican Republic
-
 Ecuador
-
 Egypt
-
 El Salvador
-
 Estonia
-
 Eswatini
-
 Ethiopia
-
 Finland
-
 France
-
 Georgia
-
 Germany
-
 Ghana
-
 Greece
-
 Haiti
-
 Hong Kong
-
 Hungary
-
 India
-
 Indonesia
-
 Iran, Islamic republic
-
 Iraq
-
 Ireland
-
 Israel
-
 Italy
-
 Jamaica
-
 Japan
-
 Jordan
-
 Kazakhstan
-
 Kenya
-
 Korea
-
 Kuwait
-
 Kyrgyzstan
-
 Laos
-
 Latvia
-
 Lebanon
-
 Lesotho
-
 Libya
-
 Lithuania
-
 Luxembourg
-
 Madagascar
-
 Malaysia
-
 Malta
-
 Mauritius
-
 Mexico
-
 Moldova
-
 Mongolia
-
 Montenegro
-
 Morocco
-
 Mozambique
-
 Myanmar
-
 Namibia
-
 Nepal
-
 Netherlands
-
 New Zealand
-
 Nigeria
-
 North Macedonia
-
 Norway
-
 Oman
-
 Pakistan
-
 Palestine
-
 Panama
-
 Papua New Guinea
-
 Paraguay
-
 Peru
-
 Philippines
-
 Poland
-
 Portugal
-
 Puerto Rico
-
 Qatar
-
 Reunion
-
 Romania
-
 Rwanda
-
 Saudi Arabia
-
 Serbia
-
 Singapore
-
 Slovakia
-
 Slovenia
-
 Somalia
-
 South Africa
-
 Spain
-
 Sri Lanka
-
 Sweden
-
 Switzerland
-
 Syria
-
 Taiwan
-
 Tajikistan
-
 Tanzania
-
 Thailand
-
 Trinidad and Tobago
-
 Tunisia
-
 Turkey
-
 UAE
-
 Uganda
-
 Ukraine
-
 United Kingdom
-
United States
-
 Uruguay
-
 Uzbekistan
-
 Venezuela
-
 Vietnam
-
 Yemen
-
 Zambia
-
 Zimbabwe
- Forex
- Crypto












