

VeChain weekly forecast: Sellers keep control as open interest drops and futures exposure declines

VeChain (VET) is trading near $0.0044 after falling more than 11% over the past week, as institutional interest remains a key talking point. With the asset hovering at oversold levels, this setup could shape market action in the coming days — traders will be watching for any signals of a shift or rebound as the week develops.
 0.004558
0.00520000
Highlights
- VeChain fell 11.33% over the past week and closed at $0.004408, the lowest point of its recent trading range.
- The price remains below key moving averages and technical indicators show a negative trend with persistent downside momentum.
- VeChain is expected to move between $0.003942 and $0.0048419 over the next 7 days, with continued risk of further declines.
Ecosystem partnerships and falling open interest shape sentiment amid support retest
Recent media coverage has highlighted VeChain's ongoing ecosystem development and institutional partnerships, including strategic ties with companies like BMW, PwC, and Walmart China, which have been pointed to as long-term fundamental supports according to LiteFinance. Kryptorevolution reported that VET is currently interacting with a critical support zone, with some traders paying attention to how futures open interest—currently around $24.8 million—has declined by 5.8%, potentially indicating a reduction in leveraged exposure. These underlying factors may influence how VET responds to technical signals in the near term.
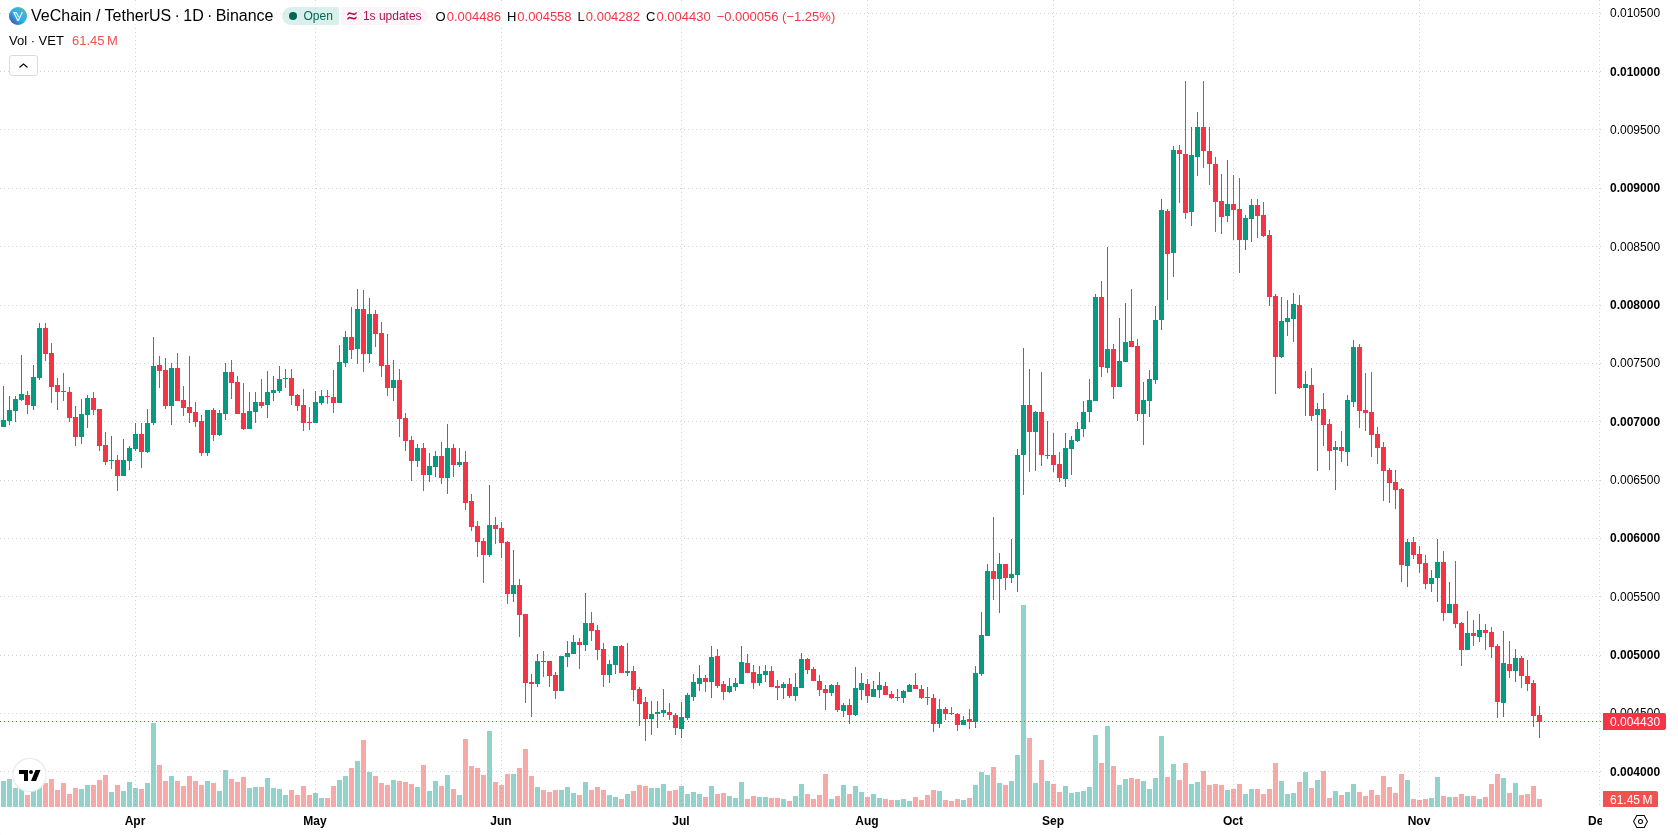
Oversold momentum builds as volatility jumps and key indicators warn of bounce risk
On the daily chart, VeChain continues to display a firm downward trend, reinforced by a sustained move lower and 18.72% volatility. Both RSI and CCI are in oversold territory, with the RSI reading at 28.08, which suggests selling exhaustion could prompt a potential short-term rebound. However, the MACD and ADX both point sharply lower and the price is currently pinned just above support at $0.00438, with resistance at the 20-day moving average of $0.00516035 and the Ichimoku Kijun at $0.005602. The negative momentum character coupled with oversold conditions highlights that while downside pressure remains dominant, the risk of a corrective bounce is increasing.
Further downside favored for next week as support break threatens extended losses
Over the next 7 days, VeChain is expected to trade within a range of $0.003942 to $0.0048419. There is a very low probability of a rebound and a very high probability of further downside. The base case is continued trading near support at $0.00438, with a break higher toward $0.00516035 possible if oversold conditions drive short-term buyers. A close below $0.00438 would put the lower end of the expected range in play and signal renewed weakness.
Earlier, analysts noted that VeChain’s persistent technical weakness and seller dominance signaled a high likelihood of continued downside movement. This outlook is reinforced by the latest data, with price action and technical indicators underscoring the importance of monitoring the $0.00438 support zone as a trigger for either renewed declines or a potential corrective rebound.










-
 Afghanistan
-
 Albania
-
 Algeria
-
 Angola
-
 Argentina
-
 Armenia
-
 Australia
-
 Austria
-
 Azerbaijan
-
 Bahamas
-
 Bahrain
-
 Bangladesh
-
 Belarus
-
 Belgium
-
 Bolivia
-
 Botswana
-
 Brazil
-
 Brunei
-
 Bulgaria
-
 Cambodia
-
 Cameroon
-
 Canada
-
 Chile
-
 China
-
 Colombia
-
 Congo
-
 Costa Rica
-
 Cote d'Ivoire
-
 Croatia
-
 Cuba
-
 Cyprus
-
 Czechia
-
 DR Congo
-
 Denmark
-
 Dominican Republic
-
 Ecuador
-
 Egypt
-
 El Salvador
-
 Estonia
-
 Eswatini
-
 Ethiopia
-
 Finland
-
 France
-
 Georgia
-
 Germany
-
 Ghana
-
 Greece
-
 Haiti
-
 Hong Kong
-
 Hungary
-
 India
-
 Indonesia
-
 Iran, Islamic republic
-
 Iraq
-
 Ireland
-
 Israel
-
 Italy
-
 Jamaica
-
 Japan
-
 Jordan
-
 Kazakhstan
-
 Kenya
-
 Korea
-
 Kuwait
-
 Kyrgyzstan
-
 Laos
-
 Latvia
-
 Lebanon
-
 Lesotho
-
 Libya
-
 Lithuania
-
 Luxembourg
-
 Madagascar
-
 Malaysia
-
 Malta
-
 Mauritius
-
 Mexico
-
 Moldova
-
 Mongolia
-
 Montenegro
-
 Morocco
-
 Mozambique
-
 Myanmar
-
 Namibia
-
 Nepal
-
 Netherlands
-
 New Zealand
-
 Nigeria
-
 North Macedonia
-
 Norway
-
 Oman
-
 Pakistan
-
 Palestine
-
 Panama
-
 Papua New Guinea
-
 Paraguay
-
 Peru
-
 Philippines
-
 Poland
-
 Portugal
-
 Puerto Rico
-
 Qatar
-
 Reunion
-
 Romania
-
 Rwanda
-
 Saudi Arabia
-
 Serbia
-
 Singapore
-
 Slovakia
-
 Slovenia
-
 Somalia
-
 South Africa
-
 Spain
-
 Sri Lanka
-
 Sweden
-
 Switzerland
-
 Syria
-
 Taiwan
-
 Tajikistan
-
 Tanzania
-
 Thailand
-
 Trinidad and Tobago
-
 Tunisia
-
 Turkey
-
 UAE
-
 Uganda
-
 Ukraine
-
 United Kingdom
-
United States
-
 Uruguay
-
 Uzbekistan
-
 Venezuela
-
 Vietnam
-
 Yemen
-
 Zambia
-
 Zimbabwe
- Forex
- Crypto












