

Can Ethereum hold support as ETF outflows weigh on sentiment?

Ethereum (ETH) is trading at $1,879.64, marking a slight decline on the day. The price remains positioned below its key moving averages, indicating subdued short-term momentum.
 1716.58
1866.89
Highlights
- U.S. spot Ethereum ETFs recorded a net outflow of $2.26 million for the week ending August 14, ending five consecutive weeks of net inflows.
- This move indicates reduced institutional demand for Ethereum, raising concerns about limited near-term liquidity for the asset.
- ETH/USD trades below key moving averages with multiple oversold signals, a near-term range of $1,842 to $1,897, and a 76% probability of further declines.
Net ETF outflows as institutional demand moderates
U.S. spot Ethereum ETFs posted a $2.26 million net outflow over the week ending August 14, marking an end to five consecutive weeks of net inflows, according to Coindoo. This reversal signals a reduction in institutional demand, which may dampen market sentiment and limit near-term liquidity for Ethereum. The shift follows a period of steady inflows, suggesting that investor allocation preferences have recently changed.
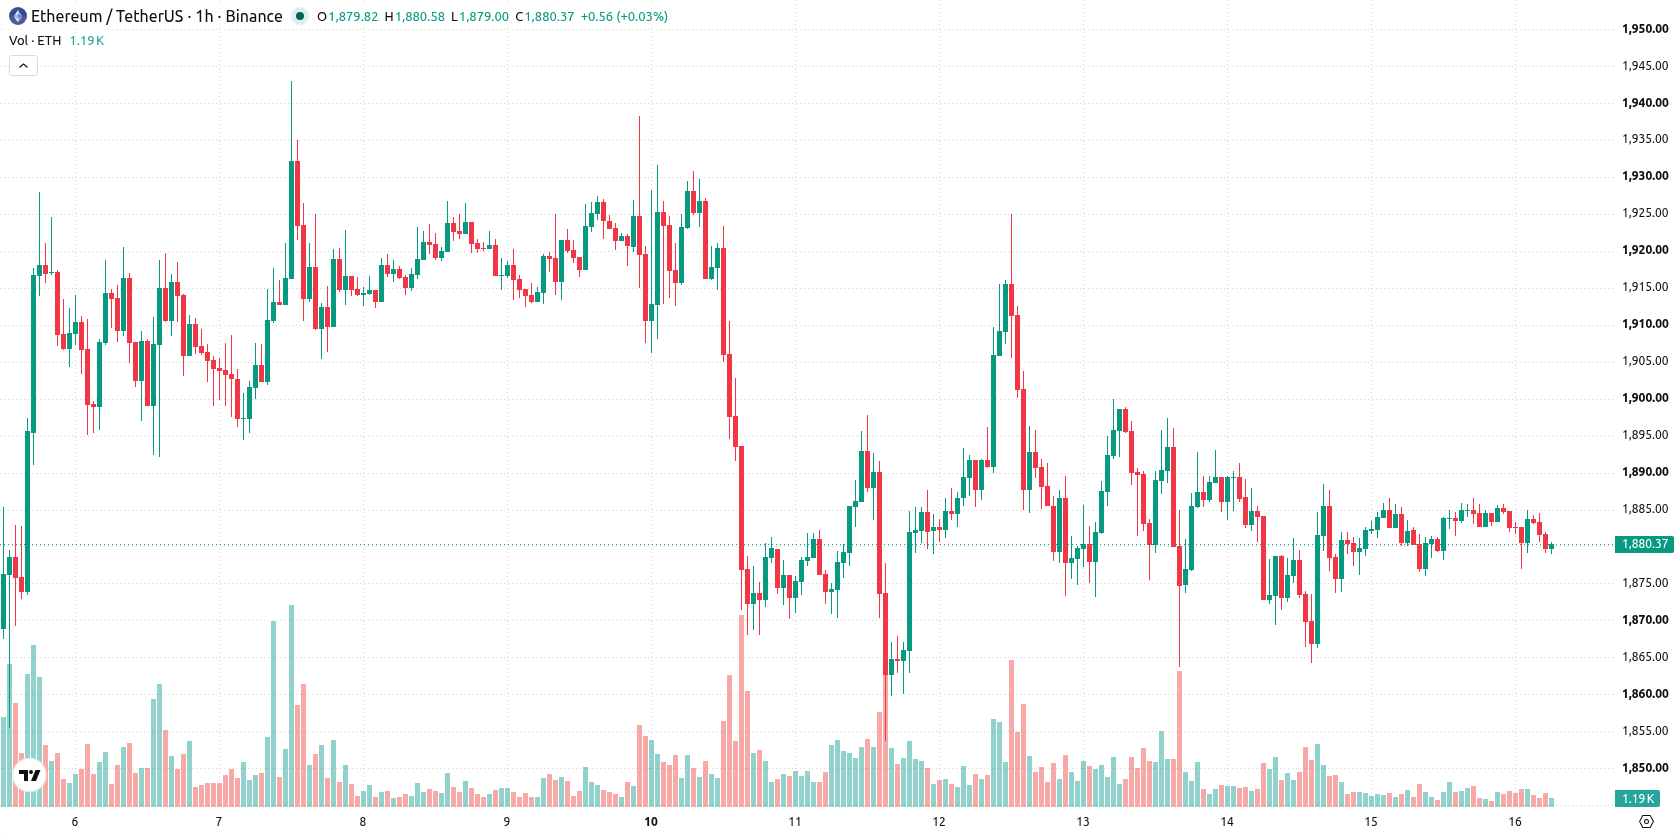
Bearish momentum persists amid mixed trend signals and stretched sellers
ETH/USD currently sits below several notable technical thresholds: the MA-20 at $1,883, the MA-50 at $1,880, and the long-term MA-200 at $2,019. The Ichimoku Kijun at $1,881 presents immediate resistance for upward moves. Momentum and trend readings are mixed, with both MACD and ADX indicating neutral trends, while the RSI at 44.2 gives a Sell signal. Additional indicators—Stochastic RSI, CCI, and Bull/Bear Power—also point to seller-dominant or oversold conditions, and the Awesome Oscillator remains neutral. Combined, these facts highlight a market environment where bearish momentum is established, though sellers may be increasingly stretched intraday.
Range-bound outlook as upside momentum remains weak
Looking ahead to the next two or three sessions, price action is expected to remain within a typical volatility band of $1,842 to $1,897. The probability of a sustained upward move is low, estimated at 24%, versus a 76% likelihood of further declines. If ETH holds above $1,842 while staying below $1,897, sideways consolidation could persist. A break above the Kijun resistance and $1,897 would be needed to signal bullish reversal potential, while a move below $1,842 could trigger accelerated selling.
Earlier, analysts noted that Ethereum faced persistent downside pressure and subdued momentum amid regulatory developments and muted institutional flows. The current shift to net outflows from U.S. spot ETFs reinforces the bearish scenario, highlighting $1,842 as a critical downside risk level to monitor in the sessions ahead.











-
 Afghanistan
-
 Albania
-
 Algeria
-
 Angola
-
 Argentina
-
 Armenia
-
 Australia
-
 Austria
-
 Azerbaijan
-
 Bahamas
-
 Bahrain
-
 Bangladesh
-
 Belarus
-
 Belgium
-
 Bolivia
-
 Botswana
-
 Brazil
-
 Brunei
-
 Bulgaria
-
 Cambodia
-
 Cameroon
-
 Canada
-
 Chile
-
 China
-
 Colombia
-
 Congo
-
 Costa Rica
-
 Cote d'Ivoire
-
 Croatia
-
 Cuba
-
 Cyprus
-
 Czechia
-
 DR Congo
-
 Denmark
-
 Dominican Republic
-
 Ecuador
-
 Egypt
-
 El Salvador
-
 Estonia
-
 Eswatini
-
 Ethiopia
-
 Finland
-
 France
-
 Georgia
-
 Germany
-
 Ghana
-
 Greece
-
 Haiti
-
 Hong Kong
-
 Hungary
-
 India
-
 Indonesia
-
 Iran, Islamic republic
-
 Iraq
-
 Ireland
-
 Israel
-
 Italy
-
 Jamaica
-
 Japan
-
 Jordan
-
 Kazakhstan
-
 Kenya
-
 Korea
-
 Kuwait
-
 Kyrgyzstan
-
 Laos
-
 Latvia
-
 Lebanon
-
 Lesotho
-
 Libya
-
 Lithuania
-
 Luxembourg
-
 Madagascar
-
 Malaysia
-
 Malta
-
 Mauritius
-
 Mexico
-
 Moldova
-
 Mongolia
-
 Montenegro
-
 Morocco
-
 Mozambique
-
 Myanmar
-
 Namibia
-
 Nepal
-
 Netherlands
-
 New Zealand
-
 Nigeria
-
 North Macedonia
-
 Norway
-
 Oman
-
 Pakistan
-
 Palestine
-
 Panama
-
 Papua New Guinea
-
 Paraguay
-
 Peru
-
 Philippines
-
 Poland
-
 Portugal
-
 Puerto Rico
-
 Qatar
-
 Reunion
-
 Romania
-
 Rwanda
-
 Saudi Arabia
-
 Serbia
-
 Singapore
-
 Slovakia
-
 Slovenia
-
 Somalia
-
 South Africa
-
 Spain
-
 Sri Lanka
-
 Sweden
-
 Switzerland
-
 Syria
-
 Taiwan
-
 Tajikistan
-
 Tanzania
-
 Thailand
-
 Trinidad and Tobago
-
 Tunisia
-
 Turkey
-
 UAE
-
 Uganda
-
 Ukraine
-
 United Kingdom
-
United States
-
 Uruguay
-
 Uzbekistan
-
 Venezuela
-
 Vietnam
-
 Yemen
-
 Zambia
-
 Zimbabwe
- Forex
- Crypto












