

FLOKI climbs as sellers cap upside at key resistance

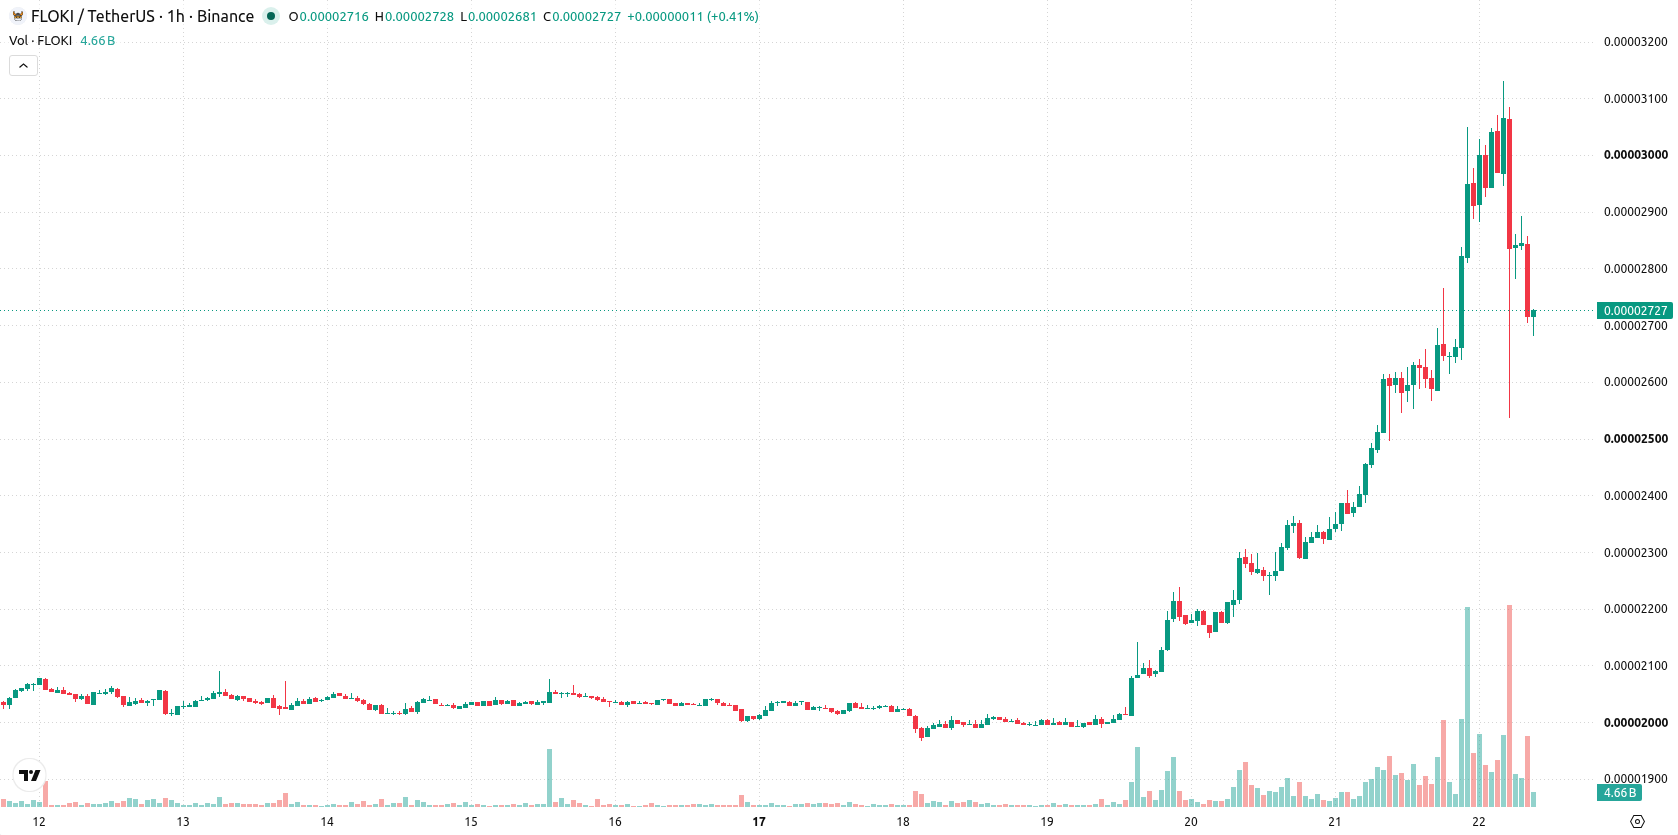
Floki (FLOKI) is trading at $0.0000271, up 6.75% on the day. The asset is currently below its key short-term moving average but above its medium-term average, pointing to mixed momentum in the near term.
 0.0000189
0.00002144
Highlights
- Floki trades below short-term averages and slightly under the long-term trend, indicating persistent bearish momentum.
- Momentum indicators are mixed, with short-term seller pressure dominating despite strong buy signals on some oscillators.
- Price is expected to remain in a $0.00002468 to $0.00002952 range over the next sessions, with a 70% probability of an upward move.
Bullish bias limited by long-term caution and intraday seller strength
On the technical side, FLOKI is trading below the MA-20 while remaining above the MA-50. The price is just under the MA-200, keeping the long-term trend on the cautious side. Immediate resistance is marked by the Ichimoku Kijun at $0.00002803. MACD indicates a strong buy configuration, and the ADX shows a buy signal as well, whereas RSI sits at a neutral 56 and CCI is also neutral. Stochastic RSI signals oversold territory, with the Awesome Oscillator staying neutral. Bull/Bear Power signals dominant seller strength intraday, despite upward momentum earlier in the session.
Upward scenario favored as volatility maintains current trading range
Short term, FLOKI is likely to trade within a range of $0.00002468 to $0.00002952 as volatility persists. The probability of an upward move stands high at 70%, making a downside reversal less likely in the next 2–3 sessions. If the price breaks above resistance at $0.00002803, the bullish scenario targets the upper end of the current range; if support fails, the lower boundary could be tested. The baseline expectation is for the asset to oscillate within these boundaries, consistent with typical volatility for this period.
Earlier, analysts noted that Floki exhibited strong short- and medium-term momentum, although caution remained around key resistance levels due to mixed technical signals. The current analysis reinforces the nuanced outlook by highlighting the importance of the $0.00002803 resistance, with ongoing volatility making a decisive breakout or reversal at this level the key development to watch in the coming sessions.










-
 Afghanistan
-
 Albania
-
 Algeria
-
 Angola
-
 Argentina
-
 Armenia
-
 Australia
-
 Austria
-
 Azerbaijan
-
 Bahamas
-
 Bahrain
-
 Bangladesh
-
 Belarus
-
 Belgium
-
 Bolivia
-
 Botswana
-
 Brazil
-
 Brunei
-
 Bulgaria
-
 Cambodia
-
 Cameroon
-
 Canada
-
 Chile
-
 China
-
 Colombia
-
 Congo
-
 Costa Rica
-
 Cote d'Ivoire
-
 Croatia
-
 Cuba
-
 Cyprus
-
 Czechia
-
 DR Congo
-
 Denmark
-
 Dominican Republic
-
 Ecuador
-
 Egypt
-
 El Salvador
-
 Estonia
-
 Eswatini
-
 Ethiopia
-
 Finland
-
 France
-
 Georgia
-
 Germany
-
 Ghana
-
 Greece
-
 Haiti
-
 Hong Kong
-
 Hungary
-
 India
-
 Indonesia
-
 Iran, Islamic republic
-
 Iraq
-
 Ireland
-
 Israel
-
 Italy
-
 Jamaica
-
 Japan
-
 Jordan
-
 Kazakhstan
-
 Kenya
-
 Korea
-
 Kuwait
-
 Kyrgyzstan
-
 Laos
-
 Latvia
-
 Lebanon
-
 Lesotho
-
 Libya
-
 Lithuania
-
 Luxembourg
-
 Madagascar
-
 Malaysia
-
 Malta
-
 Mauritius
-
 Mexico
-
 Moldova
-
 Mongolia
-
 Montenegro
-
 Morocco
-
 Mozambique
-
 Myanmar
-
 Namibia
-
 Nepal
-
 Netherlands
-
 New Zealand
-
 Nigeria
-
 North Macedonia
-
 Norway
-
 Oman
-
 Pakistan
-
 Palestine
-
 Panama
-
 Papua New Guinea
-
 Paraguay
-
 Peru
-
 Philippines
-
 Poland
-
 Portugal
-
 Puerto Rico
-
 Qatar
-
 Reunion
-
 Romania
-
 Rwanda
-
 Saudi Arabia
-
 Serbia
-
 Singapore
-
 Slovakia
-
 Slovenia
-
 Somalia
-
 South Africa
-
 Spain
-
 Sri Lanka
-
 Sweden
-
 Switzerland
-
 Syria
-
 Taiwan
-
 Tajikistan
-
 Tanzania
-
 Thailand
-
 Trinidad and Tobago
-
 Tunisia
-
 Turkey
-
 UAE
-
 Uganda
-
 Ukraine
-
 United Kingdom
-
United States
-
 Uruguay
-
 Uzbekistan
-
 Venezuela
-
 Vietnam
-
 Yemen
-
 Zambia
-
 Zimbabwe
- Forex
- Crypto












