

Pepe overbought technicals temper optimism amid firm trend: weekly outlook

Pepe (PEPE) is holding near $0.000004, closing the week with a gain of almost 4%, as ETF inflows across crypto dominated the narrative. Momentum in the asset persisted with institutional and retail interest fueled by recent ETF chatter, even as stretched technicals emerged. In the coming week, traders will look to see if support levels can anchor the advance after the latest run-up.
 0.0538
0.054690
Highlights
- Pepe trades at $0.000004, gaining 3.83% over the past week and maintaining price action above key averages.
- Technical indicators show strong trend momentum though overbought conditions may restrict the pace of additional gains.
- Expected trading range for next week is $0.000003507 to $0.000004492, with support at $0.00000363 and resistance at $0.00000456.
ETF filing and Bitcoin rally fuel sentiment shift over the week
Canary Capital's filing of an S-1 with the SEC for a spot PEPE ETF in April 2026 stood out as a key development, according to Blockchain.News, sparking renewed optimism around regulatory recognition for meme tokens. Technical analysis from AMBCrypto, FXStreet, and Benzinga noted that Pepe faced resistance and saw some profit-taking after a strong rally, while on-chain data highlighted persistent whale concentration. Broader crypto market sentiment also improved amid surging ETF inflows and Bitcoin's rally, indirectly boosting PEPE's demand outlook for the week ahead.
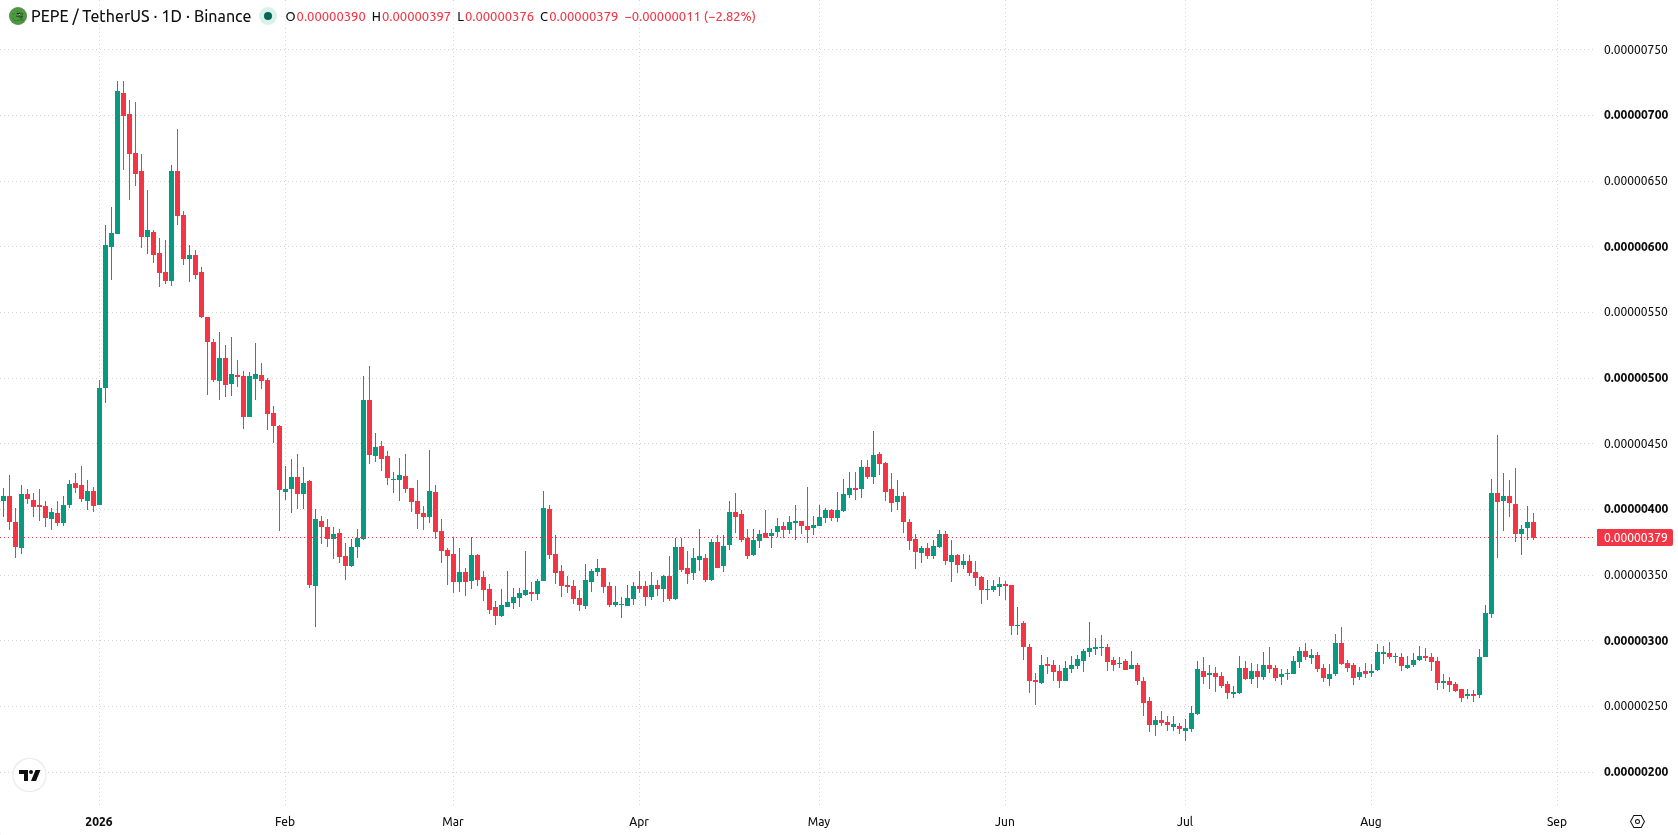
Overbought momentum persists amid firm trend and high volatility this week
On the daily chart, structure is defined by a sustained move higher with a firm trend, backed by high seven-day volatility of 25.62%. RSI stands at 70.16, signaling an overbought zone, while MACD continues to support the advance and ADX corroborates with a buy direction. Nearest support lies at $0.00000363, with resistance at $0.00000456, and the Ichimoku Kijun at $0.000003545 acting as a practical support level. This positioning and indicator alignment suggest follow-through remains likely, though overbought momentum readings may temper the pace.
Bullish bias next week as support holds and breakout risk rises
Next week, the expected range is $0.000003507 to $0.000004492, with a very high probability of an increase and a very low probability of a decrease. The base case anticipates continued trading within this band, anchored by the strength above $0.00000363 support and resistance at $0.00000456 capping the upside. A sustained push above resistance could open the path toward the upper boundary of forecasts, while a move below support would risk further downside toward the lower end of the range.
Earlier, analysts noted that Pepe had entered a consolidation phase following rapid gains, with bullish momentum sustained above key technical supports. The current analysis builds on this outlook by highlighting elevated volatility and overbought momentum, indicating that traders should closely monitor $0.00000363 as the primary support for any shift in near-term direction.






Latest PEPE/USD News




-
 Afghanistan
-
 Albania
-
 Algeria
-
 Angola
-
 Argentina
-
 Armenia
-
 Australia
-
 Austria
-
 Azerbaijan
-
 Bahamas
-
 Bahrain
-
 Bangladesh
-
 Belarus
-
 Belgium
-
 Bolivia
-
 Botswana
-
 Brazil
-
 Brunei
-
 Bulgaria
-
 Cambodia
-
 Cameroon
-
 Canada
-
 Chile
-
 China
-
 Colombia
-
 Congo
-
 Costa Rica
-
 Cote d'Ivoire
-
 Croatia
-
 Cuba
-
 Cyprus
-
 Czechia
-
 DR Congo
-
 Denmark
-
 Dominican Republic
-
 Ecuador
-
 Egypt
-
 El Salvador
-
 Estonia
-
 Eswatini
-
 Ethiopia
-
 Finland
-
 France
-
 Georgia
-
 Germany
-
 Ghana
-
 Greece
-
 Haiti
-
 Hong Kong
-
 Hungary
-
 India
-
 Indonesia
-
 Iran, Islamic republic
-
 Iraq
-
 Ireland
-
 Israel
-
 Italy
-
 Jamaica
-
 Japan
-
 Jordan
-
 Kazakhstan
-
 Kenya
-
 Korea
-
 Kuwait
-
 Kyrgyzstan
-
 Laos
-
 Latvia
-
 Lebanon
-
 Lesotho
-
 Libya
-
 Lithuania
-
 Luxembourg
-
 Madagascar
-
 Malaysia
-
 Malta
-
 Mauritius
-
 Mexico
-
 Moldova
-
 Mongolia
-
 Montenegro
-
 Morocco
-
 Mozambique
-
 Myanmar
-
 Namibia
-
 Nepal
-
 Netherlands
-
 New Zealand
-
 Nigeria
-
 North Macedonia
-
 Norway
-
 Oman
-
 Pakistan
-
 Palestine
-
 Panama
-
 Papua New Guinea
-
 Paraguay
-
 Peru
-
 Philippines
-
 Poland
-
 Portugal
-
 Puerto Rico
-
 Qatar
-
 Reunion
-
 Romania
-
 Rwanda
-
 Saudi Arabia
-
 Serbia
-
 Singapore
-
 Slovakia
-
 Slovenia
-
 Somalia
-
 South Africa
-
 Spain
-
 Sri Lanka
-
 Sweden
-
 Switzerland
-
 Syria
-
 Taiwan
-
 Tajikistan
-
 Tanzania
-
 Thailand
-
 Trinidad and Tobago
-
 Tunisia
-
 Turkey
-
 UAE
-
 Uganda
-
 Ukraine
-
 United Kingdom
-
United States
-
 Uruguay
-
 Uzbekistan
-
 Venezuela
-
 Vietnam
-
 Yemen
-
 Zambia
-
 Zimbabwe
- Forex
- Crypto












