


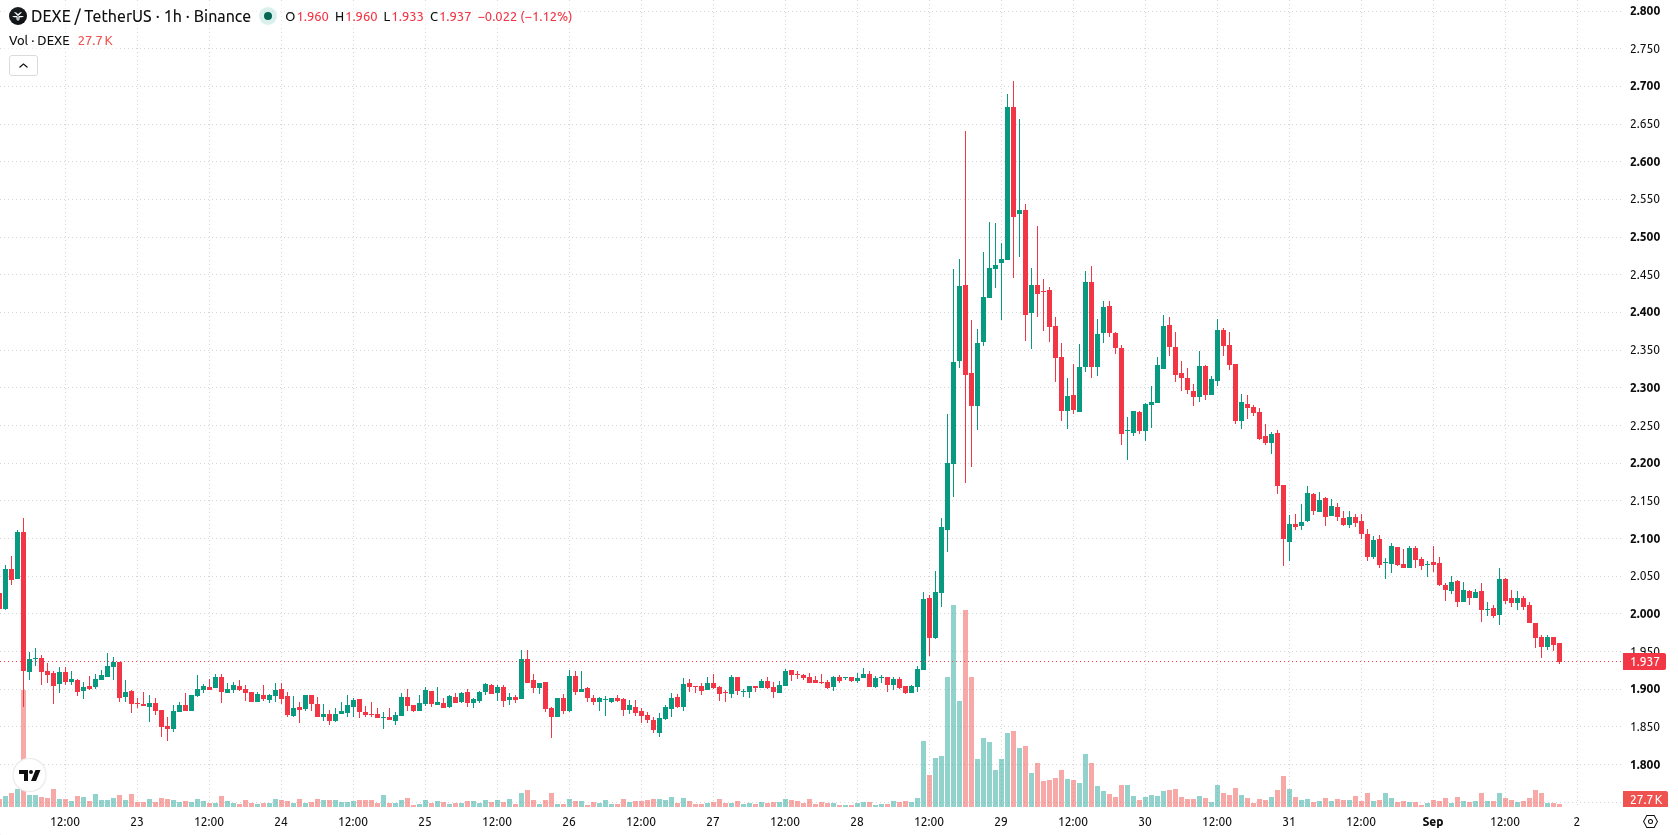
DeXe (DEXE) is trading at $1.94, marking a daily decline of 6.96%. The asset remains below its key moving averages.
 1.1
1.32
Highlights
- DeXe trades below key moving averages on short, medium, and long timeframes, indicating persistent selling pressure.
- Momentum and volume indicators remain negative, with most signals in oversold or bearish territory, confirming strong seller control.
- Price is projected to consolidate in the $1.75 to $2.13 range over the next 2 to 3 days, with low probability of a near-term reversal.
Persistent downside momentum as sellers dominate technical indicators
On the hourly timeframe, DEXE is positioned below the MA-20 and MA-50, while the daily chart shows the price well under the MA-200. The Ichimoku Kijun at $2.02 represents immediate resistance. Indicators continue to signal strong selling momentum: MACD and ADX both indicate a sell bias; RSI remains in sell territory. Stoch RSI and CCI are oversold, suggesting that sellers may be losing some momentum, while Bull/Bear Power stays negative. The Awesome Oscillator also supports the ongoing downside pressure.
Continued bearish bias as recovery hinges on resistance break
Over the next 2–3 trading days, DEXE is likely to remain in a volatility band between $1.75 and $2.13. The probability of a near-term recovery is low, with continued declines more likely unless the immediate resistance at $2.02 is broken decisively. A sustained move below the lower boundary of $1.75 would confirm further bearish extension, while consolidation within this zone remains the baseline scenario.
Earlier, analysts noted that DeXe faced persistent selling pressure amid heightened trading activity and capital inflows. The current technical outlook reinforces the prior bearish view, with traders now advised to closely monitor the $1.75 level as a key downside risk in the coming sessions.










-
 Afghanistan
-
 Albania
-
 Algeria
-
 Angola
-
 Argentina
-
 Armenia
-
 Australia
-
 Austria
-
 Azerbaijan
-
 Bahamas
-
 Bahrain
-
 Bangladesh
-
 Belarus
-
 Belgium
-
 Bolivia
-
 Botswana
-
 Brazil
-
 Brunei
-
 Bulgaria
-
 Cambodia
-
 Cameroon
-
 Canada
-
 Chile
-
 China
-
 Colombia
-
 Congo
-
 Costa Rica
-
 Cote d'Ivoire
-
 Croatia
-
 Cuba
-
 Cyprus
-
 Czechia
-
 DR Congo
-
 Denmark
-
 Dominican Republic
-
 Ecuador
-
 Egypt
-
 El Salvador
-
 Estonia
-
 Eswatini
-
 Ethiopia
-
 Finland
-
 France
-
 Georgia
-
 Germany
-
 Ghana
-
 Greece
-
 Haiti
-
 Hong Kong
-
 Hungary
-
 India
-
 Indonesia
-
 Iran, Islamic republic
-
 Iraq
-
 Ireland
-
 Israel
-
 Italy
-
 Jamaica
-
 Japan
-
 Jordan
-
 Kazakhstan
-
 Kenya
-
 Korea
-
 Kuwait
-
 Kyrgyzstan
-
 Laos
-
 Latvia
-
 Lebanon
-
 Lesotho
-
 Libya
-
 Lithuania
-
 Luxembourg
-
 Madagascar
-
 Malaysia
-
 Malta
-
 Mauritius
-
 Mexico
-
 Moldova
-
 Mongolia
-
 Montenegro
-
 Morocco
-
 Mozambique
-
 Myanmar
-
 Namibia
-
 Nepal
-
 Netherlands
-
 New Zealand
-
 Nigeria
-
 North Macedonia
-
 Norway
-
 Oman
-
 Pakistan
-
 Palestine
-
 Panama
-
 Papua New Guinea
-
 Paraguay
-
 Peru
-
 Philippines
-
 Poland
-
 Portugal
-
 Puerto Rico
-
 Qatar
-
 Reunion
-
 Romania
-
 Rwanda
-
 Saudi Arabia
-
 Serbia
-
 Singapore
-
 Slovakia
-
 Slovenia
-
 Somalia
-
 South Africa
-
 Spain
-
 Sri Lanka
-
 Sweden
-
 Switzerland
-
 Syria
-
 Taiwan
-
 Tajikistan
-
 Tanzania
-
 Thailand
-
 Trinidad and Tobago
-
 Tunisia
-
 Turkey
-
 UAE
-
 Uganda
-
 Ukraine
-
 United Kingdom
-
United States
-
 Uruguay
-
 Uzbekistan
-
 Venezuela
-
 Vietnam
-
 Yemen
-
 Zambia
-
 Zimbabwe
- Forex
- Crypto












