

DeXe slumps over 10% as technical selling pressures mount

DeXe (DEXE) slumped 10.08% as sustained negative technical momentum and heavy selling pressure drove a sharp decline. The move is supported by the pair's position below all key moving averages, with momentum and oscillator readings highlighting seller control.
 1.11
1.30
Highlights
- DEXE/USD trades below key moving averages, confirming a strong downtrend across short, medium, and long timeframes.
- Momentum and volume indicators remain bearish, with sellers dominant and most gauges showing downside and oversold signals.
- DEXE/USD is projected to consolidate between $1.05 and $1.37 over the next five sessions with over 80% probability of further decline.
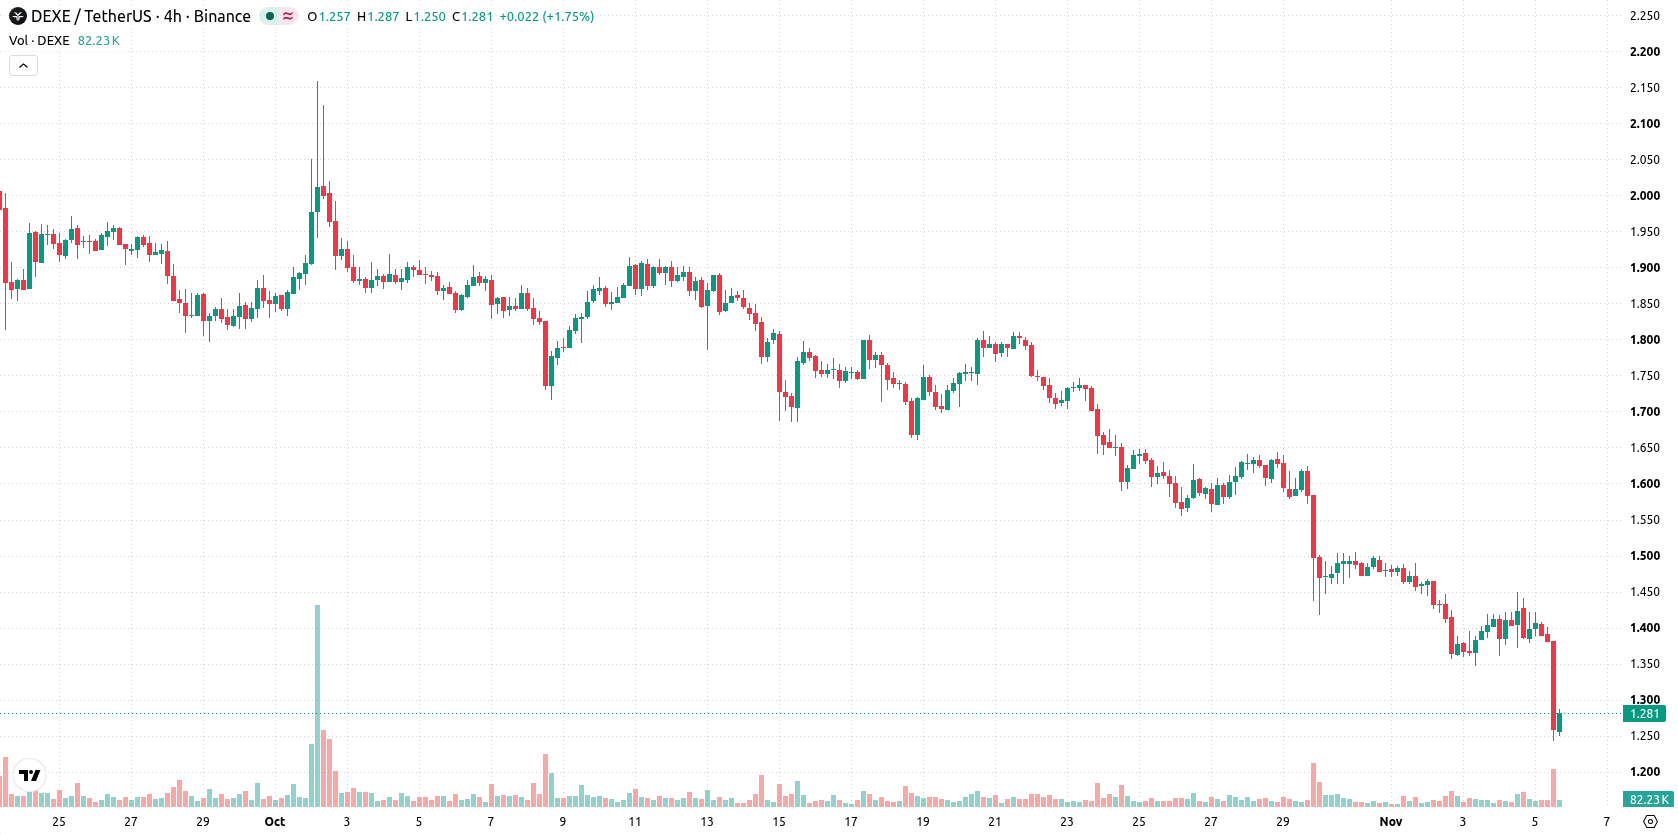
Bearish control confirmed as prices breach key technical benchmarks
DEXE/USD is trading below its 20-day, 50-day, and 200-day moving averages at $1.61, $1.77, and $10.15, indicating persistent downward pressure across short-, medium-, and long-term trends. Resistance is in place at $1.35 and support at $1.05. The configuration of the 50-day against the 200-day moving average remains bearish. MACD and ADX both signal downside momentum, showing sellers are in control. RSI and CCI are in oversold zones, suggesting possible selling exhaustion, while the Stochastic RSI is neutral. Bull/Bear Power (BBP) is negative, confirming seller dominance during intraday trading. Price action remains close to the daily low, reflecting sustained heavy sentiment after a downside gap at the open.
Earlier, analysts noted that DeXe was exhibiting persistent technical weakness and remained vulnerable to further downside risks. The current analysis reaffirms this bearish scenario, with attention now turning to the $1.05 support level as a critical threshold for any potential shift in price direction.










-
 Afghanistan
-
 Albania
-
 Algeria
-
 Angola
-
 Argentina
-
 Armenia
-
 Australia
-
 Austria
-
 Azerbaijan
-
 Bahamas
-
 Bahrain
-
 Bangladesh
-
 Belarus
-
 Belgium
-
 Bolivia
-
 Botswana
-
 Brazil
-
 Brunei
-
 Bulgaria
-
 Cambodia
-
 Cameroon
-
 Canada
-
 Chile
-
 China
-
 Colombia
-
 Congo
-
 Costa Rica
-
 Cote d'Ivoire
-
 Croatia
-
 Cuba
-
 Cyprus
-
 Czechia
-
 DR Congo
-
 Denmark
-
 Dominican Republic
-
 Ecuador
-
 Egypt
-
 El Salvador
-
 Estonia
-
 Eswatini
-
 Ethiopia
-
 Finland
-
 France
-
 Georgia
-
 Germany
-
 Ghana
-
 Greece
-
 Haiti
-
 Hong Kong
-
 Hungary
-
 India
-
 Indonesia
-
 Iran, Islamic republic
-
 Iraq
-
 Ireland
-
 Israel
-
 Italy
-
 Jamaica
-
 Japan
-
 Jordan
-
 Kazakhstan
-
 Kenya
-
 Korea
-
 Kuwait
-
 Kyrgyzstan
-
 Laos
-
 Latvia
-
 Lebanon
-
 Lesotho
-
 Libya
-
 Lithuania
-
 Luxembourg
-
 Madagascar
-
 Malaysia
-
 Malta
-
 Mauritius
-
 Mexico
-
 Moldova
-
 Mongolia
-
 Montenegro
-
 Morocco
-
 Mozambique
-
 Myanmar
-
 Namibia
-
 Nepal
-
 Netherlands
-
 New Zealand
-
 Nigeria
-
 North Macedonia
-
 Norway
-
 Oman
-
 Pakistan
-
 Palestine
-
 Panama
-
 Papua New Guinea
-
 Paraguay
-
 Peru
-
 Philippines
-
 Poland
-
 Portugal
-
 Puerto Rico
-
 Qatar
-
 Reunion
-
 Romania
-
 Rwanda
-
 Saudi Arabia
-
 Serbia
-
 Singapore
-
 Slovakia
-
 Slovenia
-
 Somalia
-
 South Africa
-
 Spain
-
 Sri Lanka
-
 Sweden
-
 Switzerland
-
 Syria
-
 Taiwan
-
 Tajikistan
-
 Tanzania
-
 Thailand
-
 Trinidad and Tobago
-
 Tunisia
-
 Turkey
-
 UAE
-
 Uganda
-
 Ukraine
-
 United Kingdom
-
United States
-
 Uruguay
-
 Uzbekistan
-
 Venezuela
-
 Vietnam
-
 Yemen
-
 Zambia
-
 Zimbabwe
- Forex
- Crypto












