

Ethereum weekly outlook: Can ETH attract more buyers with supply tightening from large institutional accumulation?

Ethereum (ETH) starts the new week trading near $2,400, retreating by just over 2% after an earlier rally spurred by robust spot ETF flows. August marked one of the strongest months for institutional demand, with increased regulated fund activity shaping ETH’s near-term direction. As buyers push higher but momentum looks stretched, attention will remain on whether renewed inflows can sustain this week’s support.
 2446.27
2538.52
Highlights
- Ethereum trades at $2,399, down $64.44 over 7 days but remains above its short- and long-term moving averages.
- Price structure stays bullish, with momentum indicators mixed and the Stochastic RSI deep in oversold territory.
- Key support is at $2,383 and resistance at $2,566, with a projected weekly range of $2,302 to $2,506 and a 68% probability of price increase.
Record ETF inflows and corporate buying sustain bullish sentiment this week
Institutional inflows into U.S. spot Ethereum ETFs surged to record highs in August 2026, with BlackRock's ETHA leading net subscriptions according to Blockonomi and Crypto.news. Corporate purchases like BitMine Immersion Technologies’ addition of over 53,000 ETH further tightened supply, while increased staking activity deepened demand. Sustained ETF appetite and regulated fund flows are expected to keep market sentiment bullish into the week.
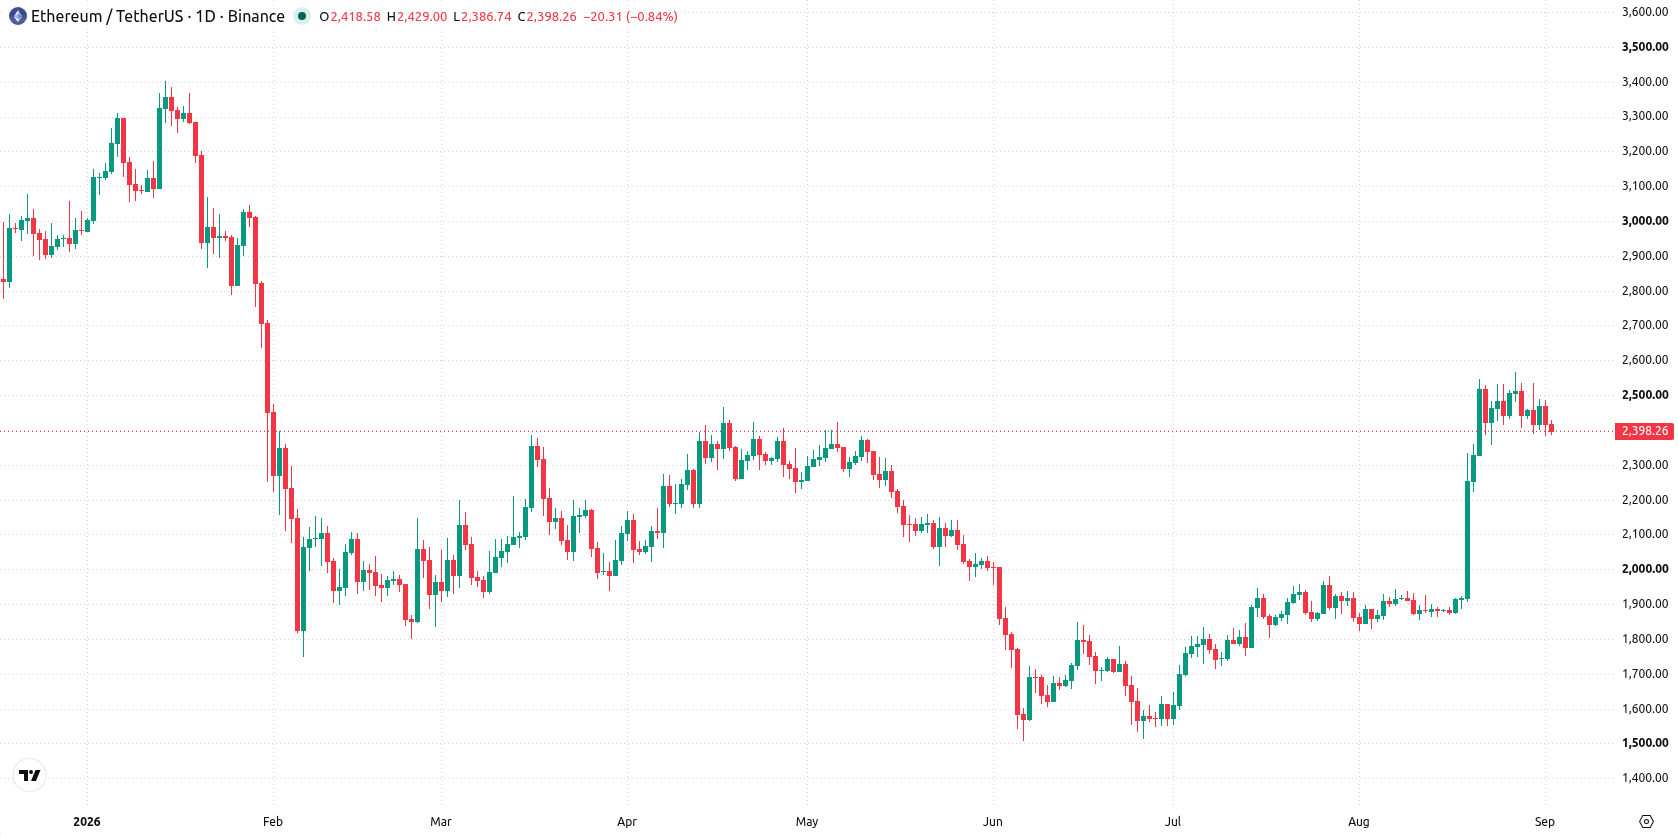
Mixed momentum signals as oversold readings clash with bullish trends this week
On the daily chart, Ethereum is showing a sustained move lower with a firm trend, as signaled by the market’s 7.69% volatility and the Stochastic RSI deep in oversold territory (0). However, momentum signals are mixed, with the RSI approaching overbought at 63.4 while the MACD remains strongly bullish. Immediate support is seen at $2,383, with resistance overhead at $2,566; the Ichimoku Kijun at $2,210 offers additional downside support. This setup points to an asset holding near the bottom of its weekly range but still structurally supported by key averages and trend signals.
Bullish bias maintained next week if key support holds amid breakout risk
Over the coming week, the expected range is $2,302 to $2,506, with a 68% probability of an increase and a 32% chance of a decline. If price holds above support at $2,383, Ethereum is likely to trade toward the mid-to-upper end of the range. A sustained move above $2,566 would signal bullish continuation. Conversely, a drop below $2,383 would open potential tests of levels closer to $2,302.
Earlier, analysts noted that downside risks for Ethereum had increased amid weakening ETF inflows and large exchange transfers, with the market appearing vulnerable to further pressure. The latest data on record institutional inflows and heightened staking activity introduces a potential shift in dynamics, making the $2,383 support level critical to watch for confirmation of continued resilience or an impending downside move.










-
 Afghanistan
-
 Albania
-
 Algeria
-
 Angola
-
 Argentina
-
 Armenia
-
 Australia
-
 Austria
-
 Azerbaijan
-
 Bahamas
-
 Bahrain
-
 Bangladesh
-
 Belarus
-
 Belgium
-
 Bolivia
-
 Botswana
-
 Brazil
-
 Brunei
-
 Bulgaria
-
 Cambodia
-
 Cameroon
-
 Canada
-
 Chile
-
 China
-
 Colombia
-
 Congo
-
 Costa Rica
-
 Cote d'Ivoire
-
 Croatia
-
 Cuba
-
 Cyprus
-
 Czechia
-
 DR Congo
-
 Denmark
-
 Dominican Republic
-
 Ecuador
-
 Egypt
-
 El Salvador
-
 Estonia
-
 Eswatini
-
 Ethiopia
-
 Finland
-
 France
-
 Georgia
-
 Germany
-
 Ghana
-
 Greece
-
 Haiti
-
 Hong Kong
-
 Hungary
-
 India
-
 Indonesia
-
 Iran, Islamic republic
-
 Iraq
-
 Ireland
-
 Israel
-
 Italy
-
 Jamaica
-
 Japan
-
 Jordan
-
 Kazakhstan
-
 Kenya
-
 Korea
-
 Kuwait
-
 Kyrgyzstan
-
 Laos
-
 Latvia
-
 Lebanon
-
 Lesotho
-
 Libya
-
 Lithuania
-
 Luxembourg
-
 Madagascar
-
 Malaysia
-
 Malta
-
 Mauritius
-
 Mexico
-
 Moldova
-
 Mongolia
-
 Montenegro
-
 Morocco
-
 Mozambique
-
 Myanmar
-
 Namibia
-
 Nepal
-
 Netherlands
-
 New Zealand
-
 Nigeria
-
 North Macedonia
-
 Norway
-
 Oman
-
 Pakistan
-
 Palestine
-
 Panama
-
 Papua New Guinea
-
 Paraguay
-
 Peru
-
 Philippines
-
 Poland
-
 Portugal
-
 Puerto Rico
-
 Qatar
-
 Reunion
-
 Romania
-
 Rwanda
-
 Saudi Arabia
-
 Serbia
-
 Singapore
-
 Slovakia
-
 Slovenia
-
 Somalia
-
 South Africa
-
 Spain
-
 Sri Lanka
-
 Sweden
-
 Switzerland
-
 Syria
-
 Taiwan
-
 Tajikistan
-
 Tanzania
-
 Thailand
-
 Trinidad and Tobago
-
 Tunisia
-
 Turkey
-
 UAE
-
 Uganda
-
 Ukraine
-
 United Kingdom
-
United States
-
 Uruguay
-
 Uzbekistan
-
 Venezuela
-
 Vietnam
-
 Yemen
-
 Zambia
-
 Zimbabwe
- Forex
- Crypto












