

BNB weekly forecast: Fundamental tailwind builds as network upgrade stirs institutional interest

BNB (BNB) is trading near $684 after slipping by about 1% over the past week, as buyers pushed the market higher but momentum has begun to look stretched. The focus moves to whether recent bullish drivers can keep pace as the coming week tests key support and resistance zones.
 584.48
692.64
Highlights
- BNB trades at $683.8, down 1.41% on the week, but remains firmly in an established uptrend.
- Technical signals show sustained buying momentum with the price holding above major averages and volatility at 6.73%.
- Forecast range for BNB is $659.78 to $725.89, with a 70% probability of further gains and key support at $674.6.
Network upgrade and institutional inflows fuel positive sentiment this week
The BNB Chain underwent a major Pasteur hard fork upgrade, which reportedly doubled network speed following its mainnet rollout on August 25, according to openPR.com, raising expectations for improved utility and engagement. Both openPR.com and Coinpedia also reported growing institutional interest, with some funds adding BNB to their core holdings and daily activity now exceeding 3.5 million active wallets, based on finance.biggo.com data. These developments help reinforce positive sentiment and add a fundamental tailwind for BNB in the week ahead.
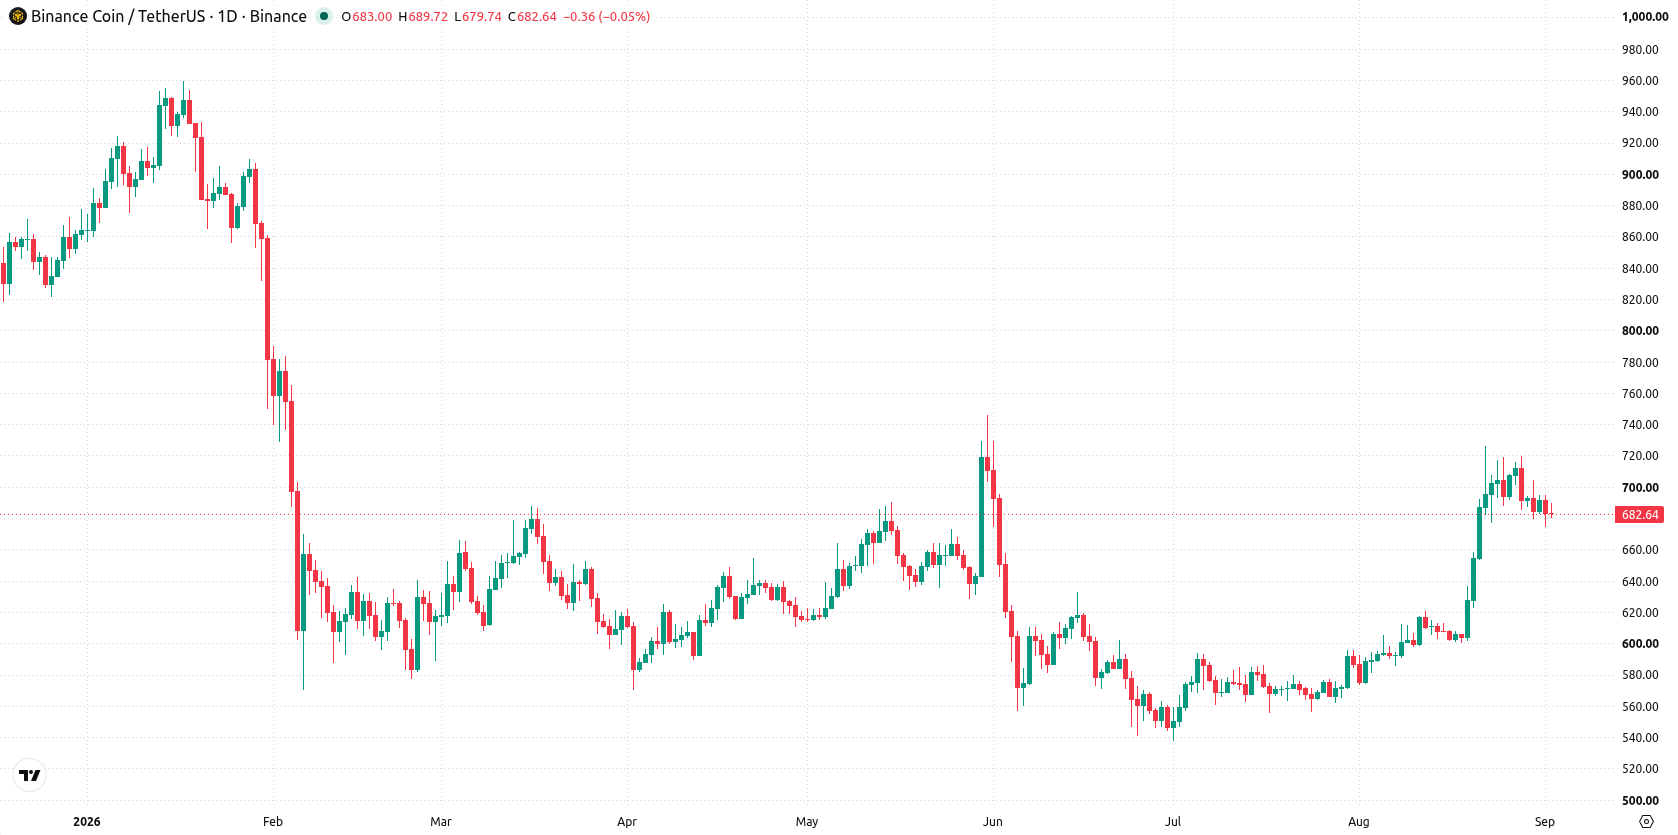
Momentum divergence emerges amid sustained buying and technical strength
The daily chart outlines a trending market, with a sustained move lower and a firm trend amid 6.73% volatility. MACD remains positive and points to continued buying momentum, while the RSI at 60.38 is approaching overbought territory, reflecting strong but slightly stretched upward momentum. However, Stochastic RSI sits at 0 in the oversold zone, highlighting a short-term momentum divergence within the broader bullish setup. Immediate support sits at $674.6, reinforced by the Ichimoku Kijun at $655.69, and resistance is at $719.99.
Upside bias seen next week as range breakout risks increase
Over the coming week, the expected range for BNB is $659.78 to $725.89. There is a 70% probability of an increase and a 30% probability of a decrease. The base case is for BNB to maintain direction within this range, using $674.6 as support and $719.99 as resistance. A break above $719.99 would open further upside, while a close below $674.6 would invalidate the trend and expose downside risk toward $659.78.
Previously it was reported that BNB maintained a bullish technical structure, supported by leadership engagement and broadening platform utility. This latest analysis adds further weight to that outlook, highlighting that the Pasteur upgrade and increased institutional adoption provide new catalysts, while a sustained move above $719.99 or below $674.6 will determine directional risk for active traders going forward.











-
 Afghanistan
-
 Albania
-
 Algeria
-
 Angola
-
 Argentina
-
 Armenia
-
 Australia
-
 Austria
-
 Azerbaijan
-
 Bahamas
-
 Bahrain
-
 Bangladesh
-
 Belarus
-
 Belgium
-
 Bolivia
-
 Botswana
-
 Brazil
-
 Brunei
-
 Bulgaria
-
 Cambodia
-
 Cameroon
-
 Canada
-
 Chile
-
 China
-
 Colombia
-
 Congo
-
 Costa Rica
-
 Cote d'Ivoire
-
 Croatia
-
 Cuba
-
 Cyprus
-
 Czechia
-
 DR Congo
-
 Denmark
-
 Dominican Republic
-
 Ecuador
-
 Egypt
-
 El Salvador
-
 Estonia
-
 Eswatini
-
 Ethiopia
-
 Finland
-
 France
-
 Georgia
-
 Germany
-
 Ghana
-
 Greece
-
 Haiti
-
 Hong Kong
-
 Hungary
-
 India
-
 Indonesia
-
 Iran, Islamic republic
-
 Iraq
-
 Ireland
-
 Israel
-
 Italy
-
 Jamaica
-
 Japan
-
 Jordan
-
 Kazakhstan
-
 Kenya
-
 Korea
-
 Kuwait
-
 Kyrgyzstan
-
 Laos
-
 Latvia
-
 Lebanon
-
 Lesotho
-
 Libya
-
 Lithuania
-
 Luxembourg
-
 Madagascar
-
 Malaysia
-
 Malta
-
 Mauritius
-
 Mexico
-
 Moldova
-
 Mongolia
-
 Montenegro
-
 Morocco
-
 Mozambique
-
 Myanmar
-
 Namibia
-
 Nepal
-
 Netherlands
-
 New Zealand
-
 Nigeria
-
 North Macedonia
-
 Norway
-
 Oman
-
 Pakistan
-
 Palestine
-
 Panama
-
 Papua New Guinea
-
 Paraguay
-
 Peru
-
 Philippines
-
 Poland
-
 Portugal
-
 Puerto Rico
-
 Qatar
-
 Reunion
-
 Romania
-
 Rwanda
-
 Saudi Arabia
-
 Serbia
-
 Singapore
-
 Slovakia
-
 Slovenia
-
 Somalia
-
 South Africa
-
 Spain
-
 Sri Lanka
-
 Sweden
-
 Switzerland
-
 Syria
-
 Taiwan
-
 Tajikistan
-
 Tanzania
-
 Thailand
-
 Trinidad and Tobago
-
 Tunisia
-
 Turkey
-
 UAE
-
 Uganda
-
 Ukraine
-
 United Kingdom
-
United States
-
 Uruguay
-
 Uzbekistan
-
 Venezuela
-
 Vietnam
-
 Yemen
-
 Zambia
-
 Zimbabwe
- Forex
- Crypto












