

Movement rises around 10.5% as bullish technical momentum and buying pressure drive advance

Movement (MOVE) surged 10.59% today as bullish technical momentum and sustained buying pressure drove the advance. The move is supported with the ticker now positioned above its short- and medium-term moving averages but still facing resistance below the long-term 200-day threshold.
 0.0049
0.005562
Highlights
- MOVE/USD trades above its 20-day and 50-day moving averages but remains below the 200-day, signaling near-term strength but long-term resistance.
- Bullish momentum is supported by positive MACD, ADX, RSI, and CCI indicator signals without overbought or oversold conditions.
- Forecast range for the next five days is $0.0083 to $0.0105, with a 68% likelihood of an upward move and $0.0093 as key support.
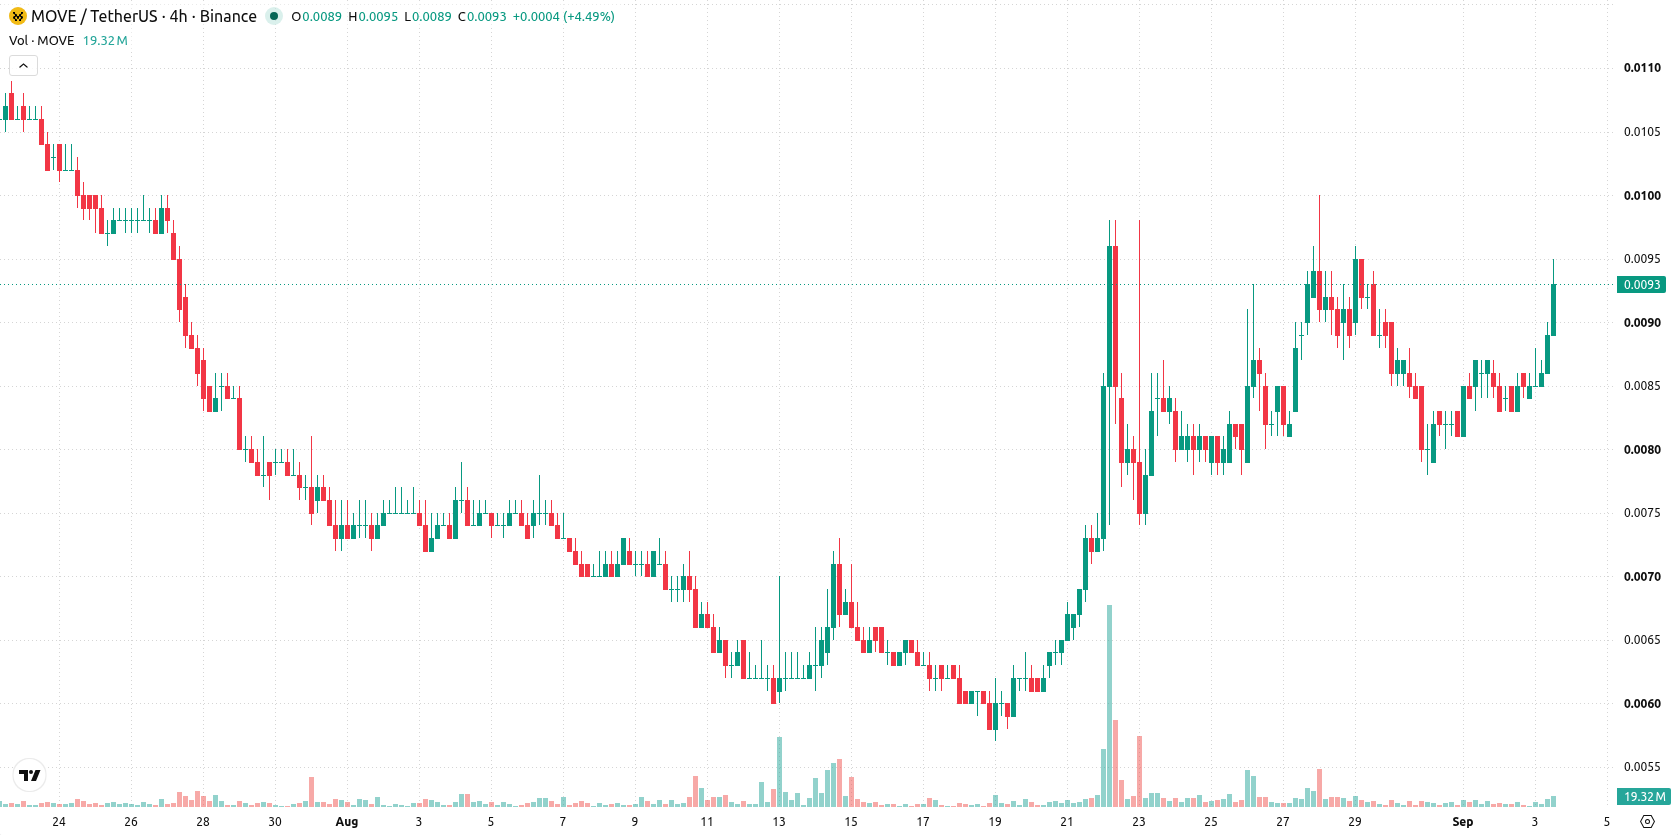
Buyers retain control as medium-term resistance caps bullish momentum
MOVE/USD is trading above its 20-day and 50-day moving averages at $0.0076 and $0.0082, but remains below the 200-day at $0.0148. This positioning signals buyers hold the short- and medium-term initiative, while longer-term momentum still faces resistance, underpinned by a bearish 50-day versus 200-day alignment; $0.0093 acts as the near-term floor, with $0.01 at the ceiling. Momentum is bullish with the Moving Average Convergence Divergence (MACD) and Average Directional Index (ADX) both generating buy signals. The Relative Strength Index (RSI) at 54 and the Commodity Channel Index (CCI) at 50 both forecast a buy, indicating no overbought or oversold extremes. Bull/Bear Power (BBP) at 0.0004 confirms buyers dominate intraday momentum. The asset opened nearly flat and has risen $0.0009 or 10.59%, now trading near the daily high with intraday volatility at 9.41%. The tone is firm with strength persisting toward session highs, though Stochastic RSI and Awesome Oscillator are neutral, marking some divergence among the oscillators.
Earlier, analysts noted that Movement (MOVE) was exhibiting heightened volatility with mixed technical signals that carried both breakout potential and mean reversion risk. The current technical setup builds on that view with firmer bullish momentum, highlighting the $0.0093 support and $0.01 resistance levels as critical inflection points for the asset’s next move.










-
 Afghanistan
-
 Albania
-
 Algeria
-
 Angola
-
 Argentina
-
 Armenia
-
 Australia
-
 Austria
-
 Azerbaijan
-
 Bahamas
-
 Bahrain
-
 Bangladesh
-
 Belarus
-
 Belgium
-
 Bolivia
-
 Botswana
-
 Brazil
-
 Brunei
-
 Bulgaria
-
 Cambodia
-
 Cameroon
-
 Canada
-
 Chile
-
 China
-
 Colombia
-
 Congo
-
 Costa Rica
-
 Cote d'Ivoire
-
 Croatia
-
 Cuba
-
 Cyprus
-
 Czechia
-
 DR Congo
-
 Denmark
-
 Dominican Republic
-
 Ecuador
-
 Egypt
-
 El Salvador
-
 Estonia
-
 Eswatini
-
 Ethiopia
-
 Finland
-
 France
-
 Georgia
-
 Germany
-
 Ghana
-
 Greece
-
 Haiti
-
 Hong Kong
-
 Hungary
-
 India
-
 Indonesia
-
 Iran, Islamic republic
-
 Iraq
-
 Ireland
-
 Israel
-
 Italy
-
 Jamaica
-
 Japan
-
 Jordan
-
 Kazakhstan
-
 Kenya
-
 Korea
-
 Kuwait
-
 Kyrgyzstan
-
 Laos
-
 Latvia
-
 Lebanon
-
 Lesotho
-
 Libya
-
 Lithuania
-
 Luxembourg
-
 Madagascar
-
 Malaysia
-
 Malta
-
 Mauritius
-
 Mexico
-
 Moldova
-
 Mongolia
-
 Montenegro
-
 Morocco
-
 Mozambique
-
 Myanmar
-
 Namibia
-
 Nepal
-
 Netherlands
-
 New Zealand
-
 Nigeria
-
 North Macedonia
-
 Norway
-
 Oman
-
 Pakistan
-
 Palestine
-
 Panama
-
 Papua New Guinea
-
 Paraguay
-
 Peru
-
 Philippines
-
 Poland
-
 Portugal
-
 Puerto Rico
-
 Qatar
-
 Reunion
-
 Romania
-
 Rwanda
-
 Saudi Arabia
-
 Serbia
-
 Singapore
-
 Slovakia
-
 Slovenia
-
 Somalia
-
 South Africa
-
 Spain
-
 Sri Lanka
-
 Sweden
-
 Switzerland
-
 Syria
-
 Taiwan
-
 Tajikistan
-
 Tanzania
-
 Thailand
-
 Trinidad and Tobago
-
 Tunisia
-
 Turkey
-
 UAE
-
 Uganda
-
 Ukraine
-
 United Kingdom
-
United States
-
 Uruguay
-
 Uzbekistan
-
 Venezuela
-
 Vietnam
-
 Yemen
-
 Zambia
-
 Zimbabwe
- Forex
- Crypto












