

Movement price prediction: Seller pressure weighs as downside momentum persists

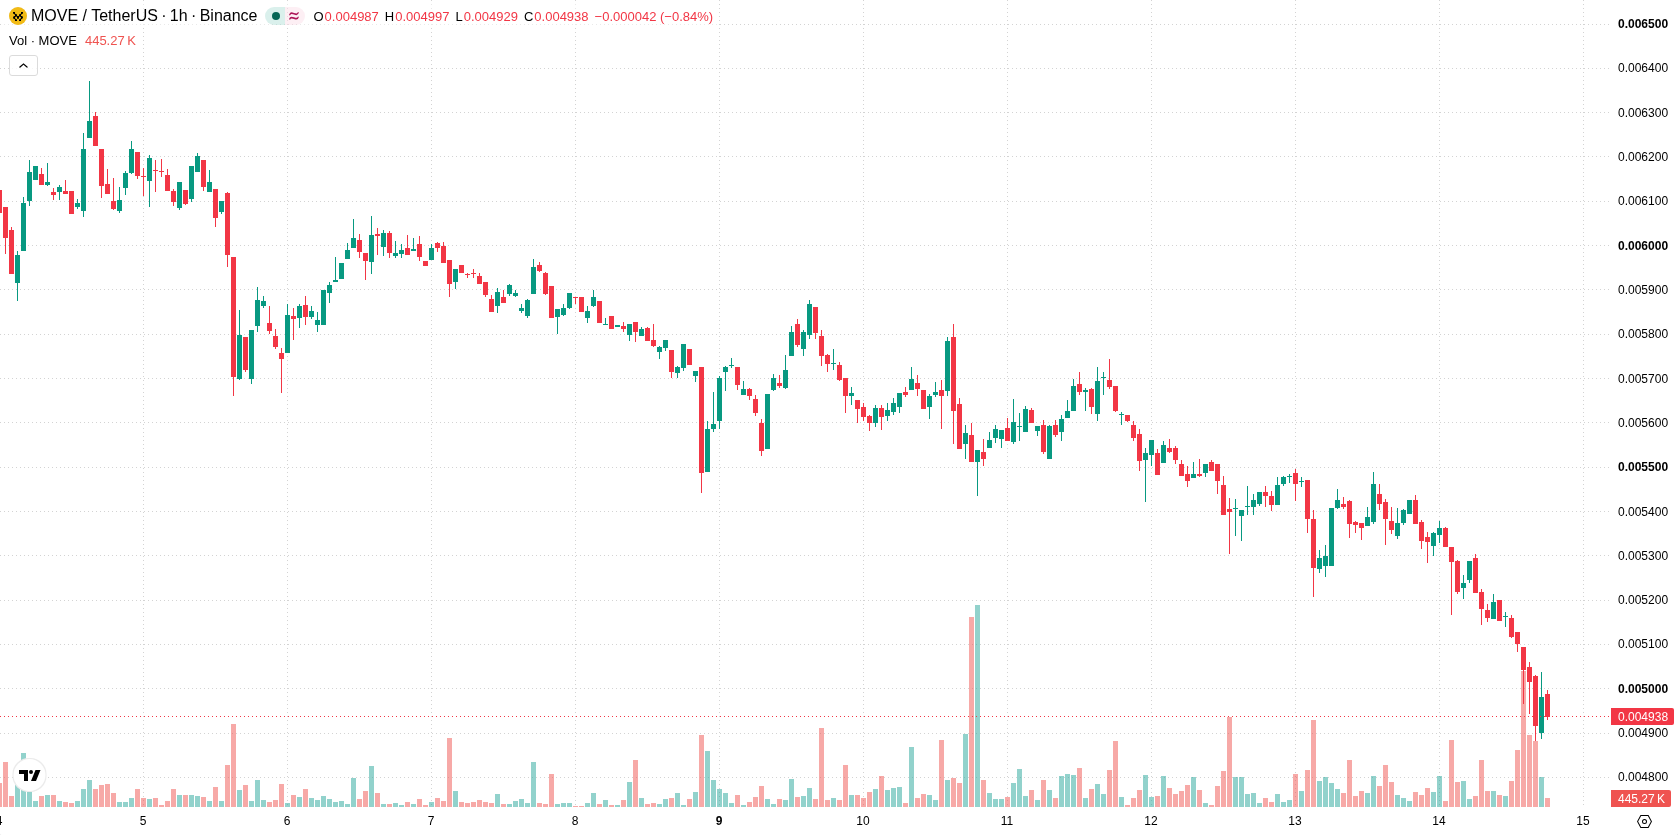
Movement (MOVE) is trading at $0.0049, registering a daily decline of 7.97%. The price is below its key moving averages, indicating persistent downside momentum in the short and medium term.
 0.0054
0.005898
Highlights
- MOVE/USD trades well below key moving averages on both hourly and daily charts, confirming a persistent bearish trend.
- Momentum and oscillator signals are unanimously negative, with multiple indicators in oversold zones and sellers dominating intraday action.
- Expected range over the next trading day is $0.0046 to $0.0051, with strong downside probability and immediate resistance at $0.0052.
Oversold oscillators and negative signals reinforce downside bias
MOVE/USD is trading below the MA-20 ($0.0052) and MA-50 ($0.0053) on the hourly chart, and remains well under the MA-200 ($0.0105) on the daily timeframe. The nearest resistance is set by the Ichimoku Kijun at $0.0052. Oscillator readings show RSI, Stoch RSI, and CCI in oversold conditions, with MACD and ADX both giving Sell signals. Bull/Bear Power is negative at -0.0002, while the Awesome Oscillator is also aligned with further downside momentum. The pair is trading very close to today's low amidst high volatility and a negative price gap.
Further selling risk rises with low probability of breakout
In the near term, MOVE/USD is expected to stay confined to a range between $0.0046 and $0.0051. The probability of an upside breakout is very low, while continued selling is more likely. If resistance at $0.0052 is broken, a sharp rebound could follow; conversely, a drop below $0.0046 could lead to further declines.
Earlier, analysts noted that Movement was experiencing continued technical weakness, with downside risks dominating the outlook. The latest price action not only confirms this bearish scenario but also highlights $0.0052 as a pivotal resistance level for any potential short-term recovery.






Latest Movement News




-
 Afghanistan
-
 Albania
-
 Algeria
-
 Angola
-
 Argentina
-
 Armenia
-
 Australia
-
 Austria
-
 Azerbaijan
-
 Bahamas
-
 Bahrain
-
 Bangladesh
-
 Belarus
-
 Belgium
-
 Bolivia
-
 Botswana
-
 Brazil
-
 Brunei
-
 Bulgaria
-
 Cambodia
-
 Cameroon
-
 Canada
-
 Chile
-
 China
-
 Colombia
-
 Congo
-
 Costa Rica
-
 Cote d'Ivoire
-
 Croatia
-
 Cuba
-
 Cyprus
-
 Czechia
-
 DR Congo
-
 Denmark
-
 Dominican Republic
-
 Ecuador
-
 Egypt
-
 El Salvador
-
 Estonia
-
 Eswatini
-
 Ethiopia
-
 Finland
-
 France
-
 Georgia
-
 Germany
-
 Ghana
-
 Greece
-
 Haiti
-
 Hong Kong
-
 Hungary
-
 India
-
 Indonesia
-
 Iran, Islamic republic
-
 Iraq
-
 Ireland
-
 Israel
-
 Italy
-
 Jamaica
-
 Japan
-
 Jordan
-
 Kazakhstan
-
 Kenya
-
 Korea
-
 Kuwait
-
 Kyrgyzstan
-
 Laos
-
 Latvia
-
 Lebanon
-
 Lesotho
-
 Libya
-
 Lithuania
-
 Luxembourg
-
 Madagascar
-
 Malaysia
-
 Malta
-
 Mauritius
-
 Mexico
-
 Moldova
-
 Mongolia
-
 Montenegro
-
 Morocco
-
 Mozambique
-
 Myanmar
-
 Namibia
-
 Nepal
-
 Netherlands
-
 New Zealand
-
 Nigeria
-
 North Macedonia
-
 Norway
-
 Oman
-
 Pakistan
-
 Palestine
-
 Panama
-
 Papua New Guinea
-
 Paraguay
-
 Peru
-
 Philippines
-
 Poland
-
 Portugal
-
 Puerto Rico
-
 Qatar
-
 Reunion
-
 Romania
-
 Rwanda
-
 Saudi Arabia
-
 Serbia
-
 Singapore
-
 Slovakia
-
 Slovenia
-
 Somalia
-
 South Africa
-
 Spain
-
 Sri Lanka
-
 Sweden
-
 Switzerland
-
 Syria
-
 Taiwan
-
 Tajikistan
-
 Tanzania
-
 Thailand
-
 Trinidad and Tobago
-
 Tunisia
-
 Turkey
-
 UAE
-
 Uganda
-
 Ukraine
-
 United Kingdom
-
United States
-
 Uruguay
-
 Uzbekistan
-
 Venezuela
-
 Vietnam
-
 Yemen
-
 Zambia
-
 Zimbabwe
- Forex
- Crypto












