

Movement falls as sellers dominate the short-term trend

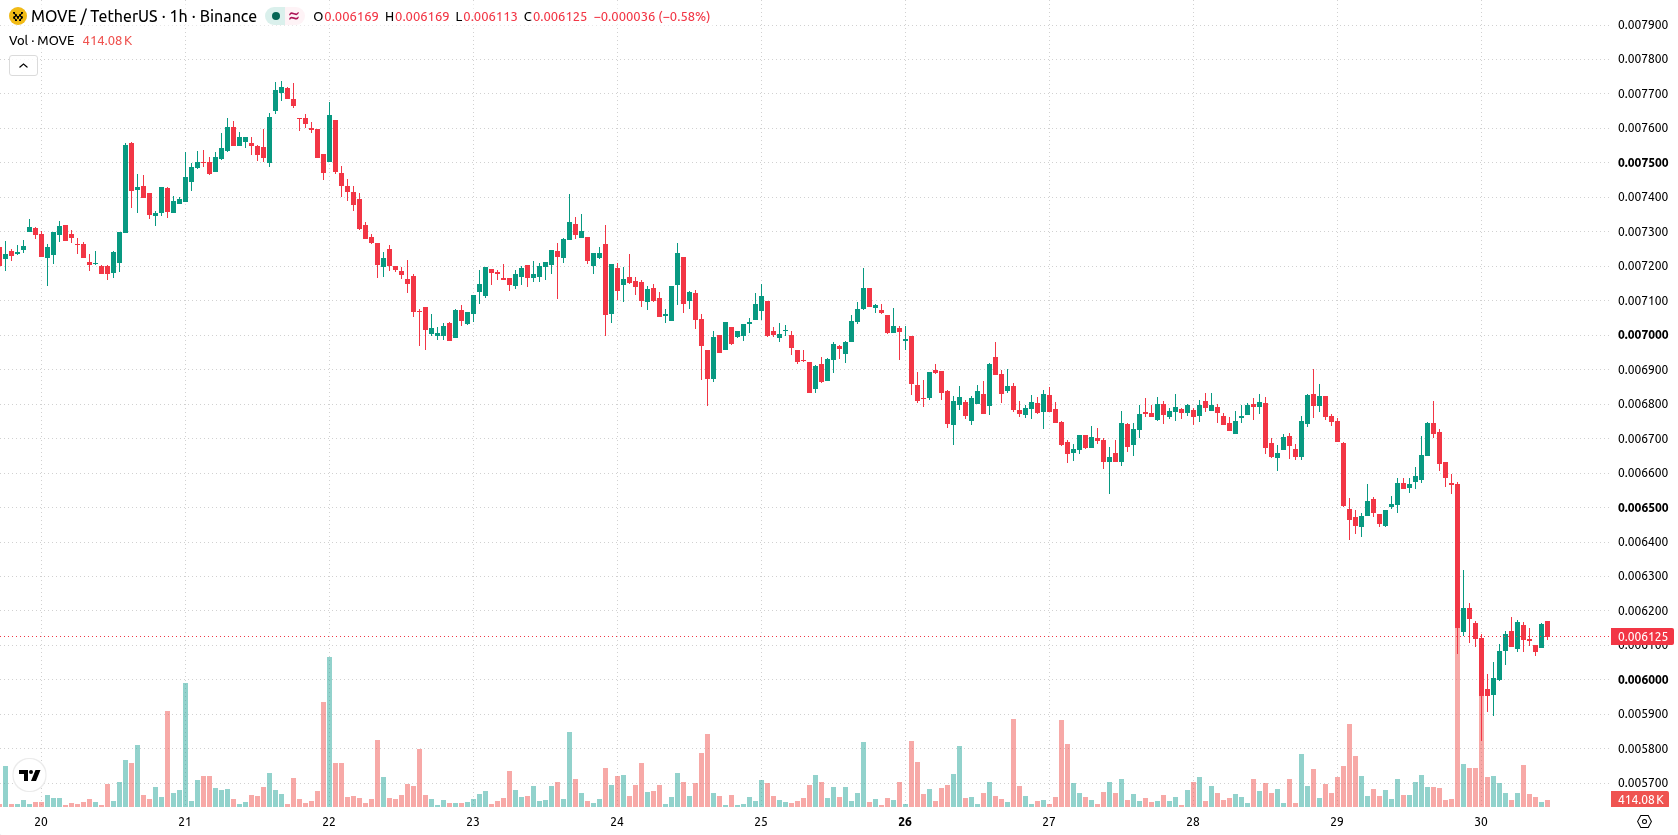
Movement (MOVE) is trading at $0.0061, marking a daily decline of 7.07%. The price remains positioned below its key moving averages, signaling a continuation of short-term and longer-term weakness.
 0.006
0.006902
Highlights
- MOVE/USD remains below key moving averages across all timeframes, confirming sustained bearish momentum under seller control.
- Technical indicators such as MACD and ADX point to strong selling pressure, with momentum readings negative and intraday volatility elevated.
- Price trades at $0.0061, down 7.07% for the day, with a projected 2 to 3 day range of $0.0058 to $0.0064 and a 74% probability for further declines.
Sustained technical pressure as momentum and oscillators diverge
On the technical front, MOVE/USD is trading below the MA-20 ($0.0062) and MA-50 ($0.0065) on the hourly chart, while also sitting well beneath the long-term MA-200 ($0.0114) on the daily chart. Immediate resistance is defined by the Ichimoku Kijun at $0.0063. Momentum indicators remain negative: MACD displays a strong sell signal, and ADX confirms active selling pressure. RSI is subdued at 37.20 (Sell), revealing weakness, while Stoch RSI is in the Overbought zone and CCI is Neutral, highlighting a divergence among oscillators. Bull/Bear Power continues to favor sellers intraday, while the Awesome Oscillator is Neutral, indicating a lack of commitment from either side.
Sideways bias as downside risks eclipse breakout odds
Over the next two to three trading days, MOVE/USD is expected to remain volatile within the range of $0.0058 to $0.0064. There is a 26% probability of an upward breakout, while a downward move holds a 74% likelihood. The base scenario calls for price consolidation within this sideways corridor; however, a sustained break above the $0.0063 resistance could trigger a bullish move, while any drop below $0.0058 may lead to further declines.
Earlier, analysts noted that Movement remained under sustained bearish pressure, with technical factors suggesting elevated downside risk. The latest data corroborate this outlook, highlighting the importance of monitoring the $0.0058 support level as a breakdown could signal further weakening in the coming sessions.






Latest Movement News




-
 Afghanistan
-
 Albania
-
 Algeria
-
 Angola
-
 Argentina
-
 Armenia
-
 Australia
-
 Austria
-
 Azerbaijan
-
 Bahamas
-
 Bahrain
-
 Bangladesh
-
 Belarus
-
 Belgium
-
 Bolivia
-
 Botswana
-
 Brazil
-
 Brunei
-
 Bulgaria
-
 Cambodia
-
 Cameroon
-
 Canada
-
 Chile
-
 China
-
 Colombia
-
 Congo
-
 Costa Rica
-
 Cote d'Ivoire
-
 Croatia
-
 Cuba
-
 Cyprus
-
 Czechia
-
 DR Congo
-
 Denmark
-
 Dominican Republic
-
 Ecuador
-
 Egypt
-
 El Salvador
-
 Estonia
-
 Eswatini
-
 Ethiopia
-
 Finland
-
 France
-
 Georgia
-
 Germany
-
 Ghana
-
 Greece
-
 Haiti
-
 Hong Kong
-
 Hungary
-
 India
-
 Indonesia
-
 Iran, Islamic republic
-
 Iraq
-
 Ireland
-
 Israel
-
 Italy
-
 Jamaica
-
 Japan
-
 Jordan
-
 Kazakhstan
-
 Kenya
-
 Korea
-
 Kuwait
-
 Kyrgyzstan
-
 Laos
-
 Latvia
-
 Lebanon
-
 Lesotho
-
 Libya
-
 Lithuania
-
 Luxembourg
-
 Madagascar
-
 Malaysia
-
 Malta
-
 Mauritius
-
 Mexico
-
 Moldova
-
 Mongolia
-
 Montenegro
-
 Morocco
-
 Mozambique
-
 Myanmar
-
 Namibia
-
 Nepal
-
 Netherlands
-
 New Zealand
-
 Nigeria
-
 North Macedonia
-
 Norway
-
 Oman
-
 Pakistan
-
 Palestine
-
 Panama
-
 Papua New Guinea
-
 Paraguay
-
 Peru
-
 Philippines
-
 Poland
-
 Portugal
-
 Puerto Rico
-
 Qatar
-
 Reunion
-
 Romania
-
 Rwanda
-
 Saudi Arabia
-
 Serbia
-
 Singapore
-
 Slovakia
-
 Slovenia
-
 Somalia
-
 South Africa
-
 Spain
-
 Sri Lanka
-
 Sweden
-
 Switzerland
-
 Syria
-
 Taiwan
-
 Tajikistan
-
 Tanzania
-
 Thailand
-
 Trinidad and Tobago
-
 Tunisia
-
 Turkey
-
 UAE
-
 Uganda
-
 Ukraine
-
 United Kingdom
-
United States
-
 Uruguay
-
 Uzbekistan
-
 Venezuela
-
 Vietnam
-
 Yemen
-
 Zambia
-
 Zimbabwe
- Forex
- Crypto












