

Will Movement hold $0.0068 support as sellers control short-term price action?

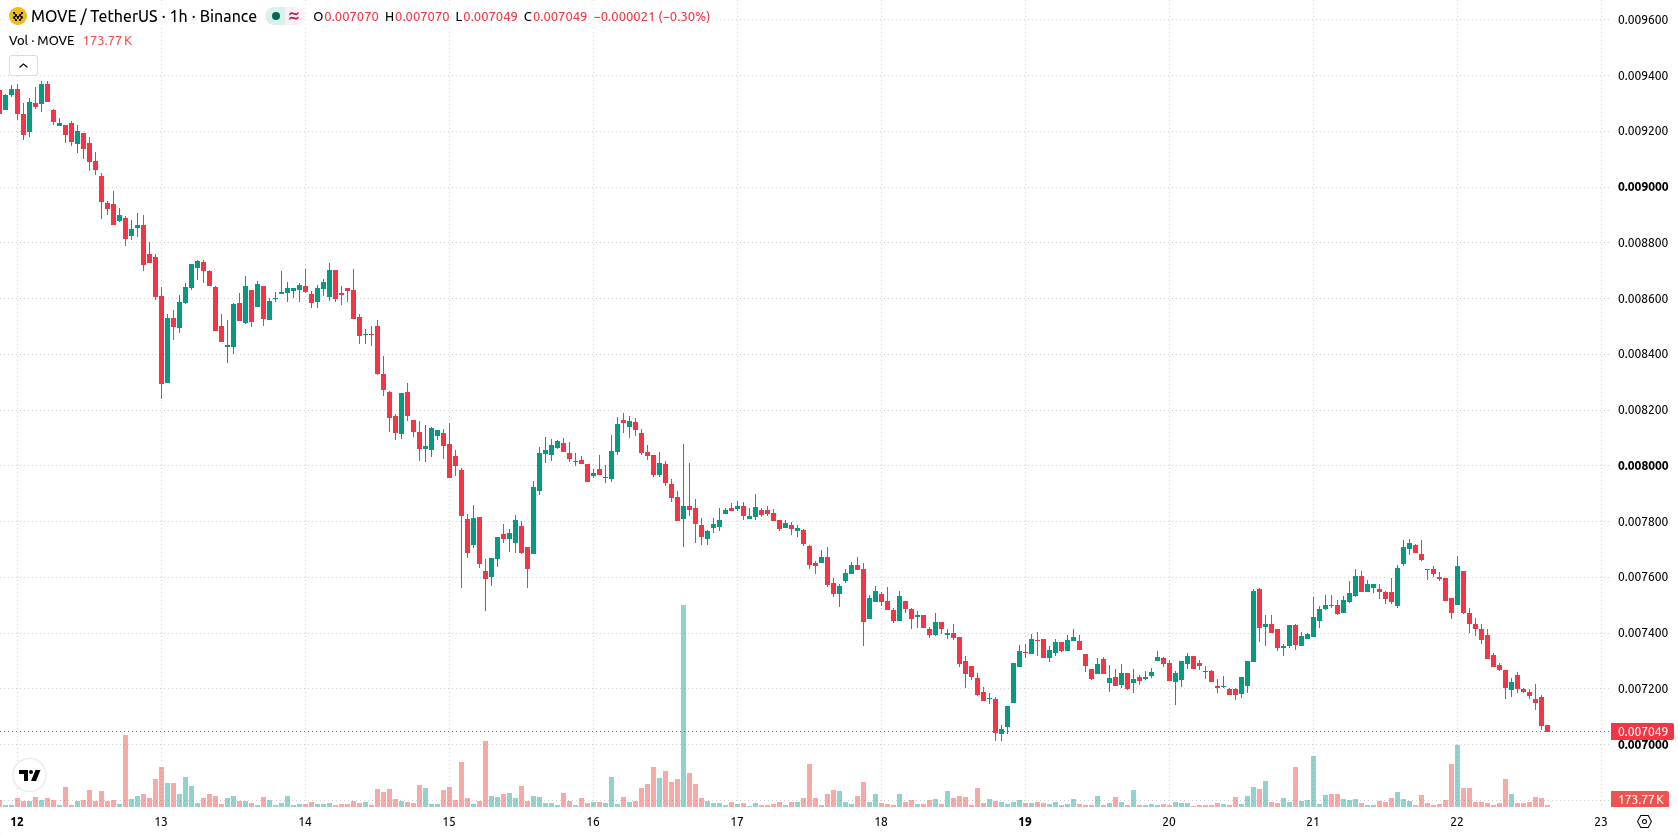
Movement (MOVE) is trading at $0.0071, marking a daily decline of 7.66%. The price remains below its key moving averages, highlighting persistent downside momentum.
 0.0062
0.006902
Highlights
- MOVE/USD trades below key moving averages on both hourly and daily charts, confirming ongoing bearish pressure.
- Momentum indicators show a clear downtrend and strong oversold conditions, with sellers dominating intraday action.
- Expected price range for the next 2 to 3 days is $0.0068 to $0.0074, with a low probability of an upward move.
Bearish momentum confirmed as MOVE breaches multiple support levels
On the technical front, MOVE is trading below the MA-20 ($0.0074) and MA-50 ($0.0074) on the hourly chart, with the price also well beneath the MA-200 ($0.0119) on the daily timeframe. The Ichimoku Kijun stands at $0.0074, serving as immediate overhead resistance. Key momentum indicators on the hourly chart show bearish conditions: MACD and ADX both reinforce the ongoing downtrend, while RSI is deeply oversold at 29.8, and CCI and Stochastic RSI similarly flag oversold territory. Bull/Bear Power confirms sustained seller dominance intraday, and the Awesome Oscillator remains neutral, offering no indication of reversal.
Limited recovery odds as MOVE eyes further consolidation
In the short term, MOVE is projected to trade within the $0.0068 to $0.0074 range over the next 2–3 sessions. The probability of an upside move is low, with the primary scenario pointing towards continued consolidation or potential weakness. A breakout above $0.0074 would indicate an attempted recovery, whereas a move below $0.0068 would open the door to deeper losses.
Earlier, analysts noted that Movement was under persistent bearish pressure, with technical factors pointing to an elevated risk of further weakness. The current analysis reinforces this view, with new lows in momentum indicators underscoring the importance of monitoring the $0.0068 level for any signs of additional downside.






Latest Movement News




-
 Afghanistan
-
 Albania
-
 Algeria
-
 Angola
-
 Argentina
-
 Armenia
-
 Australia
-
 Austria
-
 Azerbaijan
-
 Bahamas
-
 Bahrain
-
 Bangladesh
-
 Belarus
-
 Belgium
-
 Bolivia
-
 Botswana
-
 Brazil
-
 Brunei
-
 Bulgaria
-
 Cambodia
-
 Cameroon
-
 Canada
-
 Chile
-
 China
-
 Colombia
-
 Congo
-
 Costa Rica
-
 Cote d'Ivoire
-
 Croatia
-
 Cuba
-
 Cyprus
-
 Czechia
-
 DR Congo
-
 Denmark
-
 Dominican Republic
-
 Ecuador
-
 Egypt
-
 El Salvador
-
 Estonia
-
 Eswatini
-
 Ethiopia
-
 Finland
-
 France
-
 Georgia
-
 Germany
-
 Ghana
-
 Greece
-
 Haiti
-
 Hong Kong
-
 Hungary
-
 India
-
 Indonesia
-
 Iran, Islamic republic
-
 Iraq
-
 Ireland
-
 Israel
-
 Italy
-
 Jamaica
-
 Japan
-
 Jordan
-
 Kazakhstan
-
 Kenya
-
 Korea
-
 Kuwait
-
 Kyrgyzstan
-
 Laos
-
 Latvia
-
 Lebanon
-
 Lesotho
-
 Libya
-
 Lithuania
-
 Luxembourg
-
 Madagascar
-
 Malaysia
-
 Malta
-
 Mauritius
-
 Mexico
-
 Moldova
-
 Mongolia
-
 Montenegro
-
 Morocco
-
 Mozambique
-
 Myanmar
-
 Namibia
-
 Nepal
-
 Netherlands
-
 New Zealand
-
 Nigeria
-
 North Macedonia
-
 Norway
-
 Oman
-
 Pakistan
-
 Palestine
-
 Panama
-
 Papua New Guinea
-
 Paraguay
-
 Peru
-
 Philippines
-
 Poland
-
 Portugal
-
 Puerto Rico
-
 Qatar
-
 Reunion
-
 Romania
-
 Rwanda
-
 Saudi Arabia
-
 Serbia
-
 Singapore
-
 Slovakia
-
 Slovenia
-
 Somalia
-
 South Africa
-
 Spain
-
 Sri Lanka
-
 Sweden
-
 Switzerland
-
 Syria
-
 Taiwan
-
 Tajikistan
-
 Tanzania
-
 Thailand
-
 Trinidad and Tobago
-
 Tunisia
-
 Turkey
-
 UAE
-
 Uganda
-
 Ukraine
-
 United Kingdom
-
United States
-
 Uruguay
-
 Uzbekistan
-
 Venezuela
-
 Vietnam
-
 Yemen
-
 Zambia
-
 Zimbabwe
- Forex
- Crypto












