

Movement technical analysis: Approaching $0.0052 resistance as overbought oscillators warn

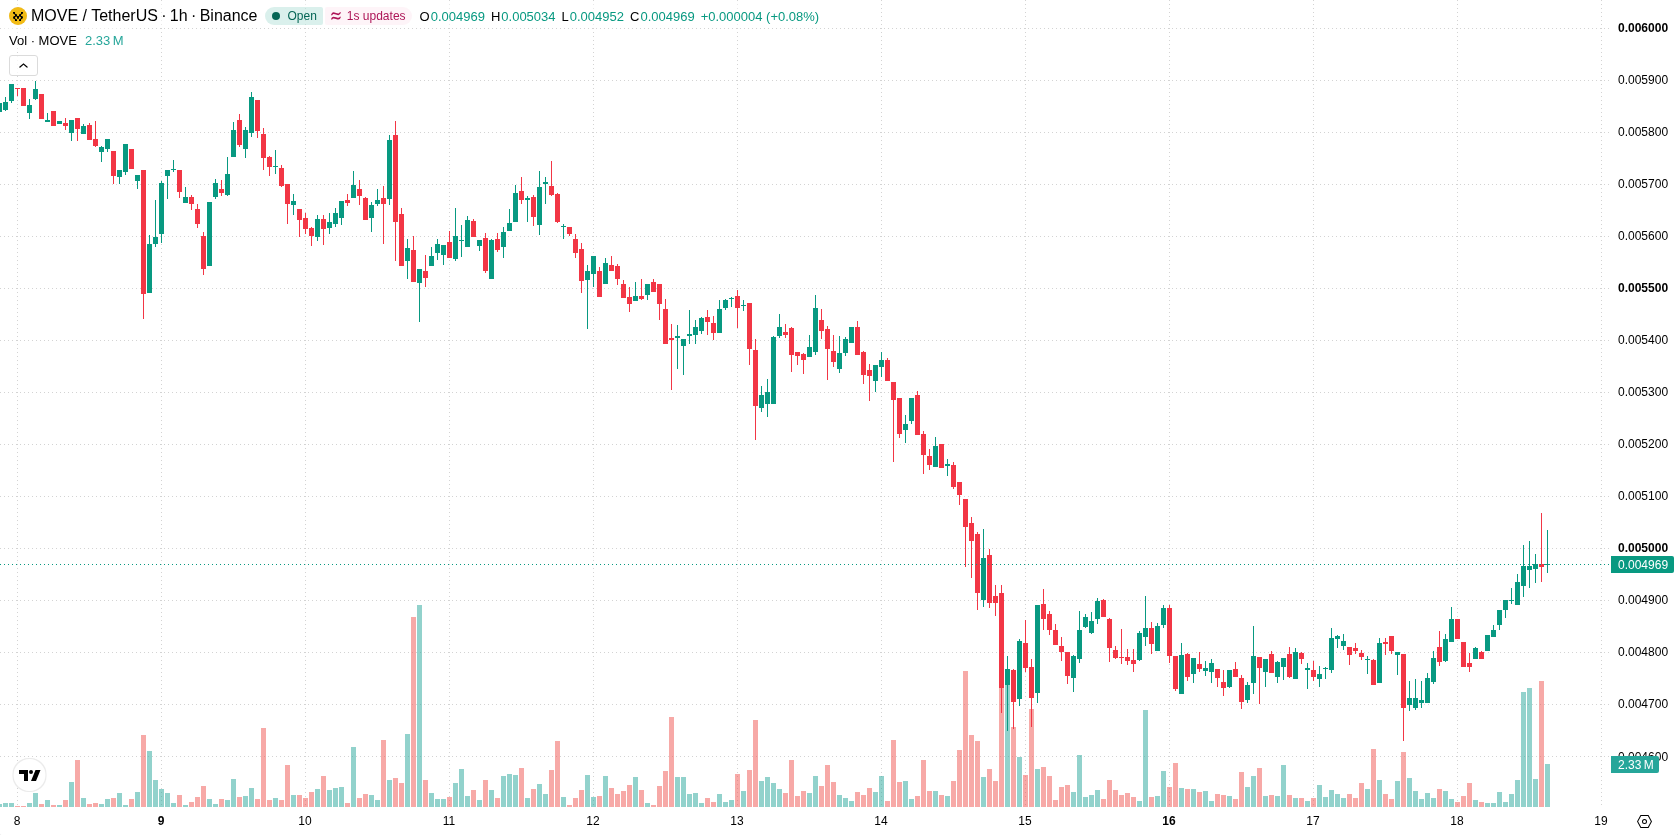
Movement (MOVE) is trading at $0.005 today, rising 7.18% in the last 24 hours as buyers control the short-term action. The price remains above its key short- and medium-term moving averages, suggesting continued upward momentum from intraday participants.
 0.005
0.005495
Highlights
- MOVE/USD remains in an upward trend on short and medium timeframes but faces longer-term selling pressure below the key daily resistance.
- Bullish momentum dominates with strong readings from MACD, ADX, and intraday buyer dominance, yet short-term oscillators indicate overbought conditions.
- The expected trading range for the next 2 to 3 days is $0.0048 to $0.0052, with a 74% probability of upward movement.
Overbought conditions heighten pullback risk despite bullish signals
MOVE/USD is trading above the H1 SMA-20 at $0.0049 and above the H1 SMA-50 at $0.0048, while remaining below the D1 SMA-200 at $0.0102. The Ichimoku Kijun at $0.0048 acts as a nearby support level. Momentum indicators, including MACD and ADX, currently signal bullish conditions. RSI, Stochastic RSI, and CCI are positioned in overbought territory, hinting at the risk of a short-term pullback. Bull/Bear Power is slightly positive at 0.0001, reflecting modest buyer dominance intraday, while the Awesome Oscillator is also in buy territory. These readings combine to produce mixed technical signals: the trend remains strong but overbought oscillators suggest potential for consolidation or cooling near current highs.
Sideways bias as further gains hinge on resistance breakout
Within the next 2–3 trading days, MOVE/USD is likely to trade between $0.0048 and $0.0052. Probability analysis points to a 74% chance of further price gains and only a 26% likelihood of a downside move. The baseline scenario is for sideways action within this volatility band; a bullish extension would require a clear break above immediate resistance, while any move below $0.0048 could tilt the balance toward a bearish scenario in the short run.
Earlier, analysts noted that Movement (MOVE) was facing persistent technical pressure with downside risks dominating the outlook. The current rebound above key short-term averages signals a potential shift, and traders should watch for consolidation between $0.0048 and $0.0052 as the balance of risks now hinges on price sustainability above immediate support.










-
 Afghanistan
-
 Albania
-
 Algeria
-
 Angola
-
 Argentina
-
 Armenia
-
 Australia
-
 Austria
-
 Azerbaijan
-
 Bahamas
-
 Bahrain
-
 Bangladesh
-
 Belarus
-
 Belgium
-
 Bolivia
-
 Botswana
-
 Brazil
-
 Brunei
-
 Bulgaria
-
 Cambodia
-
 Cameroon
-
 Canada
-
 Chile
-
 China
-
 Colombia
-
 Congo
-
 Costa Rica
-
 Cote d'Ivoire
-
 Croatia
-
 Cuba
-
 Cyprus
-
 Czechia
-
 DR Congo
-
 Denmark
-
 Dominican Republic
-
 Ecuador
-
 Egypt
-
 El Salvador
-
 Estonia
-
 Eswatini
-
 Ethiopia
-
 Finland
-
 France
-
 Georgia
-
 Germany
-
 Ghana
-
 Greece
-
 Haiti
-
 Hong Kong
-
 Hungary
-
 India
-
 Indonesia
-
 Iran, Islamic republic
-
 Iraq
-
 Ireland
-
 Israel
-
 Italy
-
 Jamaica
-
 Japan
-
 Jordan
-
 Kazakhstan
-
 Kenya
-
 Korea
-
 Kuwait
-
 Kyrgyzstan
-
 Laos
-
 Latvia
-
 Lebanon
-
 Lesotho
-
 Libya
-
 Lithuania
-
 Luxembourg
-
 Madagascar
-
 Malaysia
-
 Malta
-
 Mauritius
-
 Mexico
-
 Moldova
-
 Mongolia
-
 Montenegro
-
 Morocco
-
 Mozambique
-
 Myanmar
-
 Namibia
-
 Nepal
-
 Netherlands
-
 New Zealand
-
 Nigeria
-
 North Macedonia
-
 Norway
-
 Oman
-
 Pakistan
-
 Palestine
-
 Panama
-
 Papua New Guinea
-
 Paraguay
-
 Peru
-
 Philippines
-
 Poland
-
 Portugal
-
 Puerto Rico
-
 Qatar
-
 Reunion
-
 Romania
-
 Rwanda
-
 Saudi Arabia
-
 Serbia
-
 Singapore
-
 Slovakia
-
 Slovenia
-
 Somalia
-
 South Africa
-
 Spain
-
 Sri Lanka
-
 Sweden
-
 Switzerland
-
 Syria
-
 Taiwan
-
 Tajikistan
-
 Tanzania
-
 Thailand
-
 Trinidad and Tobago
-
 Tunisia
-
 Turkey
-
 UAE
-
 Uganda
-
 Ukraine
-
 United Kingdom
-
United States
-
 Uruguay
-
 Uzbekistan
-
 Venezuela
-
 Vietnam
-
 Yemen
-
 Zambia
-
 Zimbabwe
- Forex
- Crypto












