

Why is Stacks flat today? Key support levels to watch

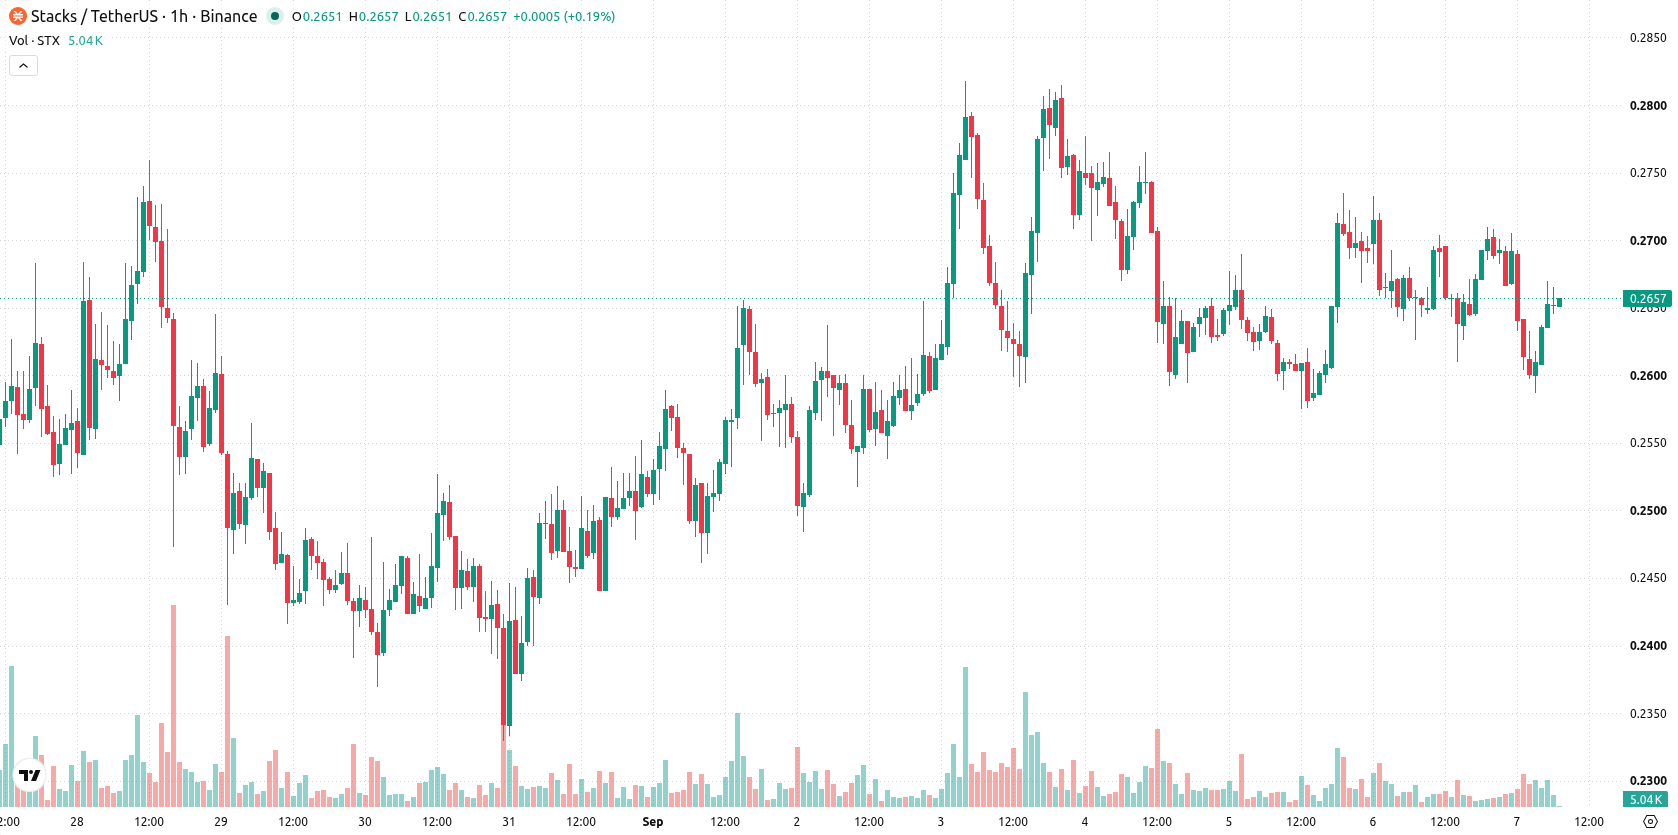
Stacks (STX) is trading at $0.2661, showing a slight intraday dip. The price holds above its key moving averages, signaling ongoing upward momentum in the short and medium term.
 0.3395
0.3990
Highlights
- STX/USD maintains a bullish bias in short- and medium-term setups, remaining well above long-term trend support.
- Momentum and oscillator indicators give mixed signals, with sellers holding an intraday advantage and volatility at moderate levels.
- Price is forecast to trade in a $0.2581 to $0.2768 range over the next two to three sessions with no decisive directional signal.
Bearish momentum persists as mixed signals cloud support
On the technical front, STX/USD stands above the MA-20 and MA-50 on the hourly chart and retains a position well above the MA-200 on the daily timeframe. The Ichimoku Kijun level at $0.2649 now serves as immediate support. Momentum, however, is predominantly bearish: MACD and Bull/Bear Power both signal sell, while ADX is neutral. RSI and CCI suggest selling pressure, and Awesome Oscillator confirms a bearish tone. Stochastic RSI is neutral, indicating no clear trend, while overall momentum readings reflect uncertainty as short-term price action does not decisively validate indicator signals.
Consolidation expected as downside risks edge higher
Looking ahead, the most likely scenario for STX is continued consolidation between $0.2581 and $0.2768 over the coming two to three sessions, a band reflecting typical volatility around current levels. Forecasts indicate a slightly higher probability for a downward move (53%), while an upside scenario would require a breakout above overhead resistance. A decline below support could open the way for deeper retracement. Overall, a sideways trading environment remains the baseline expectation.
Earlier, analysts noted that Stacks’ uptrend was being driven by sustained institutional interest and continued bullish market structure. The current analysis signals shifting momentum and increased uncertainty, with traders advised to monitor the $0.2581 support and $0.2768 resistance as the immediate trading range for potential breakouts or breakdowns.









-
 Afghanistan
-
 Albania
-
 Algeria
-
 Angola
-
 Argentina
-
 Armenia
-
 Australia
-
 Austria
-
 Azerbaijan
-
 Bahamas
-
 Bahrain
-
 Bangladesh
-
 Belarus
-
 Belgium
-
 Bolivia
-
 Botswana
-
 Brazil
-
 Brunei
-
 Bulgaria
-
 Cambodia
-
 Cameroon
-
 Canada
-
 Chile
-
 China
-
 Colombia
-
 Congo
-
 Costa Rica
-
 Cote d'Ivoire
-
 Croatia
-
 Cuba
-
 Cyprus
-
 Czechia
-
 DR Congo
-
 Denmark
-
 Dominican Republic
-
 Ecuador
-
 Egypt
-
 El Salvador
-
 Estonia
-
 Eswatini
-
 Ethiopia
-
 Finland
-
 France
-
 Georgia
-
 Germany
-
 Ghana
-
 Greece
-
 Haiti
-
 Hong Kong
-
 Hungary
-
 India
-
 Indonesia
-
 Iran, Islamic republic
-
 Iraq
-
 Ireland
-
 Israel
-
 Italy
-
 Jamaica
-
 Japan
-
 Jordan
-
 Kazakhstan
-
 Kenya
-
 Korea
-
 Kuwait
-
 Kyrgyzstan
-
 Laos
-
 Latvia
-
 Lebanon
-
 Lesotho
-
 Libya
-
 Lithuania
-
 Luxembourg
-
 Madagascar
-
 Malaysia
-
 Malta
-
 Mauritius
-
 Mexico
-
 Moldova
-
 Mongolia
-
 Montenegro
-
 Morocco
-
 Mozambique
-
 Myanmar
-
 Namibia
-
 Nepal
-
 Netherlands
-
 New Zealand
-
 Nigeria
-
 North Macedonia
-
 Norway
-
 Oman
-
 Pakistan
-
 Palestine
-
 Panama
-
 Papua New Guinea
-
 Paraguay
-
 Peru
-
 Philippines
-
 Poland
-
 Portugal
-
 Puerto Rico
-
 Qatar
-
 Reunion
-
 Romania
-
 Rwanda
-
 Saudi Arabia
-
 Serbia
-
 Singapore
-
 Slovakia
-
 Slovenia
-
 Somalia
-
 South Africa
-
 Spain
-
 Sri Lanka
-
 Sweden
-
 Switzerland
-
 Syria
-
 Taiwan
-
 Tajikistan
-
 Tanzania
-
 Thailand
-
 Trinidad and Tobago
-
 Tunisia
-
 Turkey
-
 UAE
-
 Uganda
-
 Ukraine
-
 United Kingdom
-
United States
-
 Uruguay
-
 Uzbekistan
-
 Venezuela
-
 Vietnam
-
 Yemen
-
 Zambia
-
 Zimbabwe
- Forex
- Crypto












