

Raydium price outlook: Support pressure at $0.9394 in focus

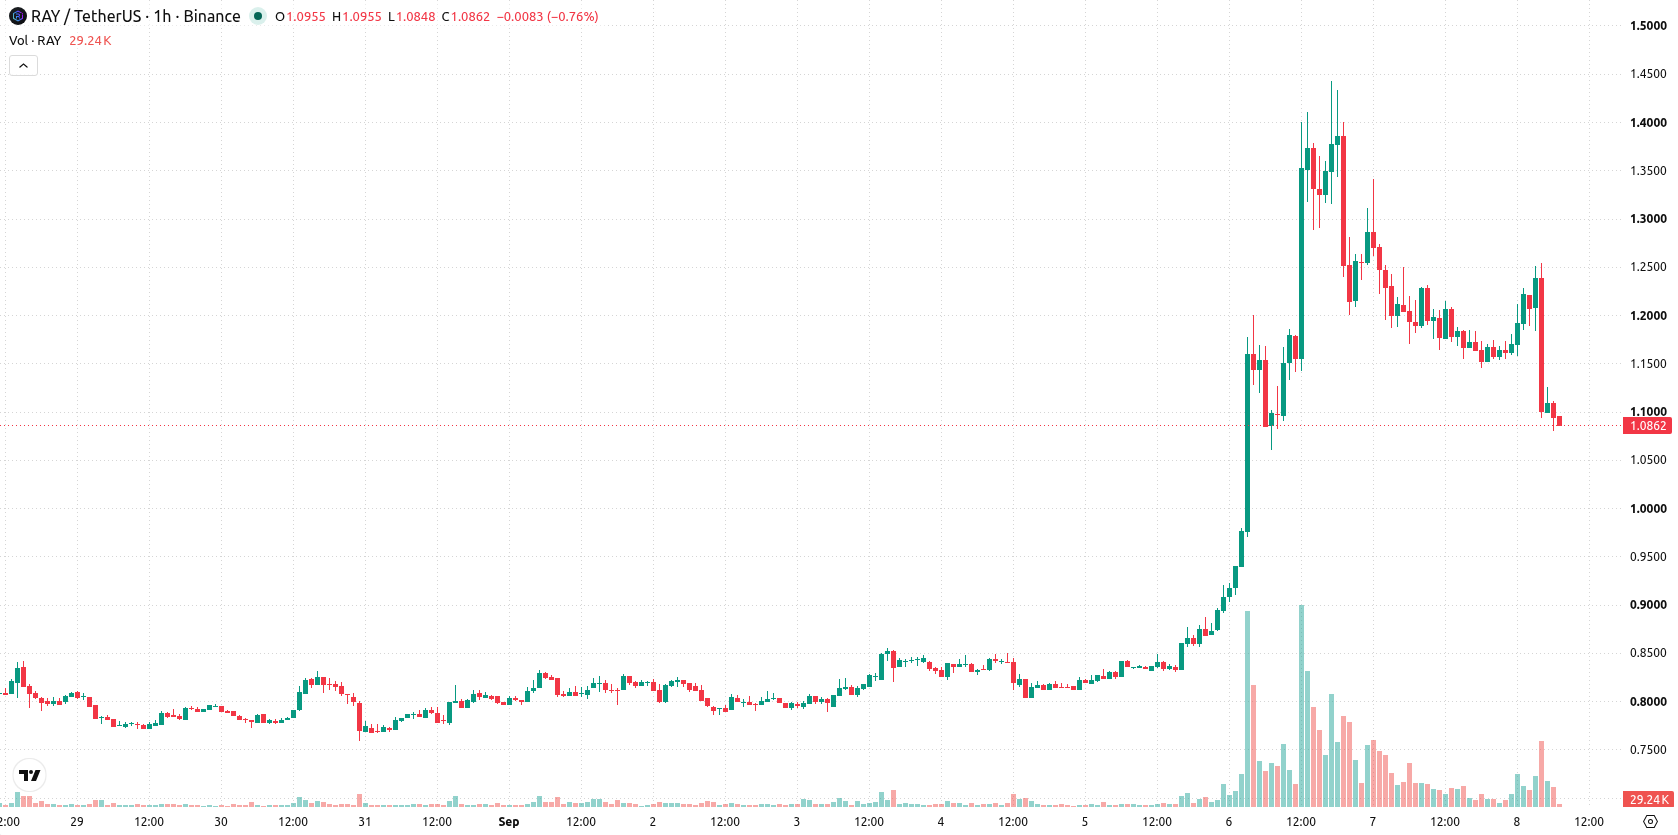
Raydium (RAY) is trading at $1.0864, down 8.74% on the day and positioned near the session’s low. The asset sits below its key short- and medium-term moving averages, while remaining above longer-term averages.
 1.8858
2.1904
1.8858
2.1904
Highlights
- Raydium generated nearly $440,000 in daily revenue after integrating LaunchOnSF's StonkFun platform with LaunchLab, spurring increased trading activity.
- Platform upgrades expanded LaunchLab to flexible token pairs on Solana, attracting more project creators and users amid broader selling pressure.
- RAY/USD trades below short- and medium-term moving averages with bearish momentum, expected in a $0.9394 to $1.2334 range over the next 2 to 3 days.
Trading volume growth follows LaunchLab integration amid market pressure
Raydium earned nearly $440,000 in daily revenue following the integration of LaunchOnSF's StonkFun platform with LaunchLab, a move that directly increased trading volume and token-related activity, according to Cryptobriefing. This confirmed result demonstrates how recent platform upgrades have translated into measurable operational gains, even as broader market pressures persist. The expansion of LaunchLab to support flexible token pairs and the introduction of this mechanism to the Solana ecosystem have positioned Raydium to attract a wider set of project creators and users, as highlighted by Blockchainreporter and Panews. These developments reflect notable productivity and innovation on the platform, though price action has remained under broader selling pressure.
Oversold signals emerge as sellers test key technical levels
On the hourly chart, RAY/USD is trading below the MA-20 and MA-50, with support from the longer-term MA-200 beneath current levels. The Ichimoku Kijun at $1.1736 acts as immediate resistance. Momentum indicators confirm this technical setup: MACD shows a sell signal and ADX points to ongoing trend strength, while RSI registers at 39.6 (Sell) and both the Stoch RSI and CCI indicate oversold conditions. Bull/Bear Power highlights seller dominance, and the Awesome Oscillator remains neutral, not actively confirming a directional trend. Price remains near the day's low against a backdrop of elevated volatility.
Range-bound trading expected as downside risk outweighs rebound potential
Over the next 2–3 trading days, the expected price range for RAY/USD is $0.9394 to $1.2334, reflecting typical volatility for the asset. The probability of an upward move stands at 43%, while the likelihood of a decline is higher. The baseline scenario sees price remaining range-bound within these levels. A break above resistance at $1.1736 would open the door to further gains, while a fall below support at $0.9394 could trigger accelerated selling momentum.
Earlier, analysts noted that Raydium was exhibiting sustained bullish momentum supported by ecosystem expansion and strong technical signals. Current price action reflects a shift to a more neutral stance, with downside risks prevailing and the $0.9394 support level emerging as critical for traders to monitor in the coming sessions.





Latest Raydium News





-
 Afghanistan
-
 Albania
-
 Algeria
-
 Angola
-
 Argentina
-
 Armenia
-
 Australia
-
 Austria
-
 Azerbaijan
-
 Bahamas
-
 Bahrain
-
 Bangladesh
-
 Belarus
-
 Belgium
-
 Bolivia
-
 Botswana
-
 Brazil
-
 Brunei
-
 Bulgaria
-
 Cambodia
-
 Cameroon
-
 Canada
-
 Chile
Chile
-
 China
China
-
 Colombia
-
 Congo
Congo
-
 Costa Rica
-
 Cote d'Ivoire
-
 Croatia
-
 Cuba
Cuba
-
 Cyprus
-
 Czechia
-
 DR Congo
-
 Denmark
-
 Dominican Republic
-
 Ecuador
-
 Egypt
Egypt
-
 El Salvador
-
 Estonia
-
 Eswatini
-
 Ethiopia
-
 Finland
-
 France
-
 Georgia
-
 Germany
-
 Ghana
Ghana
-
 Greece
-
 Haiti
Haiti
-
 Hong Kong
-
 Hungary
-
 India
India
-
 Indonesia
-
 Iran, Islamic republic
-
 Iraq
Iraq
-
 Ireland
-
 Israel
-
 Italy
Italy
-
 Jamaica
-
 Japan
Japan
-
 Jordan
-
 Kazakhstan
-
 Kenya
Kenya
-
 Korea
Korea
-
 Kuwait
-
 Kyrgyzstan
-
 Laos
Laos
-
 Latvia
-
 Lebanon
-
 Lesotho
-
 Libya
Libya
-
 Lithuania
-
 Luxembourg
-
 Madagascar
-
 Malaysia
-
 Malta
Malta
-
 Mauritius
-
 Mexico
-
 Moldova
-
 Mongolia
-
 Montenegro
-
 Morocco
-
 Mozambique
-
 Myanmar
-
 Namibia
-
 Nepal
Nepal
-
 Netherlands
-
 New Zealand
-
 Nigeria
-
 North Macedonia
-
 Norway
-
 Oman
Oman
-
 Pakistan
-
 Palestine
-
 Panama
-
 Papua New Guinea
-
 Paraguay
-
 Peru
Peru
-
 Philippines
-
 Poland
-
 Portugal
-
 Puerto Rico
-
 Qatar
Qatar
-
 Reunion
-
 Romania
-
 Rwanda
-
 Saudi Arabia
-
 Serbia
-
 Singapore
-
 Slovakia
-
 Slovenia
-
 Somalia
-
 South Africa
-
 Spain
Spain
-
 Sri Lanka
-
 Sweden
-
 Switzerland
-
 Syria
Syria
-
 Taiwan
-
 Tajikistan
-
 Tanzania
-
 Thailand
-
 Trinidad and Tobago
-
 Tunisia
-
 Turkey
-
 UAE
UAE
-
 Uganda
-
 Ukraine
-
 United Kingdom
-
United States
-
 Uruguay
-
 Uzbekistan
-
 Venezuela
-
 Vietnam
-
 Yemen
Yemen
-
 Zambia
-
 Zimbabwe
- Forex
- Crypto












