


Raydium (RAY) is trading at $1.4927, marking a 7.33% decline on the day. The asset currently sits below its key short- and medium-term moving averages, while holding above its major long-term average.
 1.4648
1.6758
Highlights
- RAY/USD trades below short- and medium-term moving averages, indicating strong selling pressure in the near term.
- Momentum indicators are mixed overall, but several show oversold conditions that could lead to a short-term rebound.
- Price recently dropped 7.33% to $1.4927, with expected consolidation between $1.43 to $1.5567 and a higher probability of downside.
Sustained seller momentum as indicators tilt bearish within range
On the technical front, RAY/USD is trading below the MA-20 and MA-50 on the hourly chart, with price remaining above the MA-200 on the daily timeframe. The Ichimoku Kijun sits at $1.5568 and acts as immediate resistance. Momentum indicators show mixed readings: MACD signals a sell bias, while ADX is neutral. The RSI is in its neutral region, but both Stoch RSI and CCI have entered oversold territory, suggesting short-term rebound risk. Bull/Bear Power is negative, confirming the dominance of sellers in intraday moves, and the Awesome Oscillator is neutral, offering no additional directional signal. Intraday weakness and strong seller momentum align with this overall momentum setup.
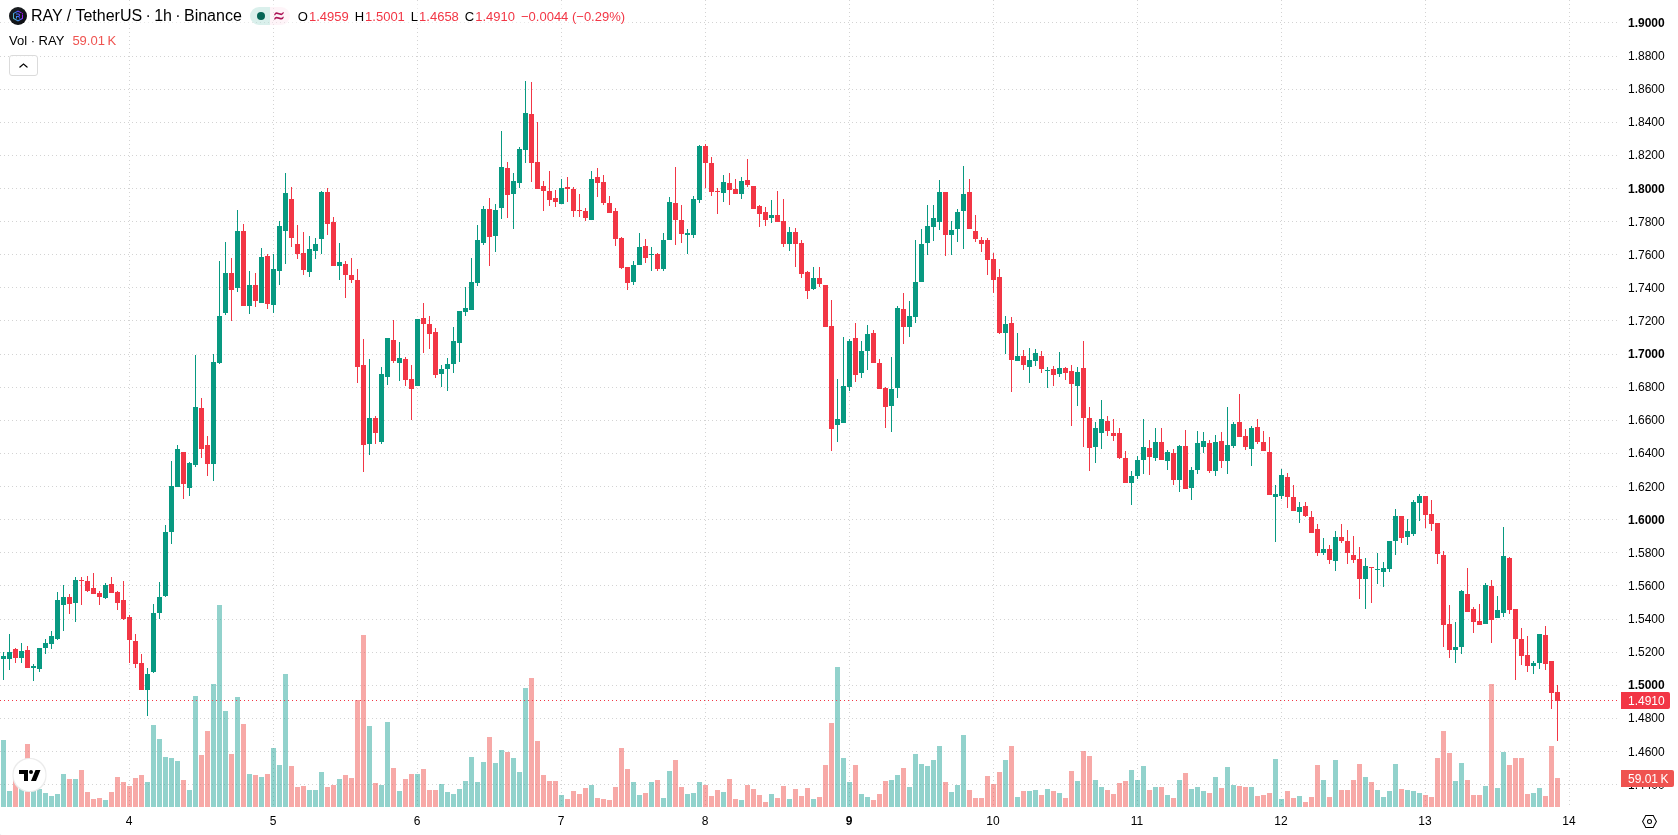
Further downside risk as price consolidates inside narrow corridor
Over the next 2–3 trading days, RAY is expected to remain within a volatility band of $1.43 to $1.5567, with a high likelihood of further downside and a low probability of a sustained rebound. Price may consolidate within this defined corridor unless $1.5568 resistance is breached, which could trigger a bullish scenario. Conversely, if the $1.43 support level fails, further declines may follow.
Earlier, analysts noted that Raydium was under sustained bearish momentum with limited prospects for a near-term upward reversal. The latest technical signals reinforce this cautious outlook, making the $1.5568 resistance and $1.43 support critical levels to monitor for signs of any decisive trend shift.










-
 Afghanistan
-
 Albania
-
 Algeria
-
 Angola
-
 Argentina
-
 Armenia
-
 Australia
-
 Austria
-
 Azerbaijan
-
 Bahamas
-
 Bahrain
-
 Bangladesh
-
 Belarus
-
 Belgium
-
 Bolivia
-
 Botswana
-
 Brazil
-
 Brunei
-
 Bulgaria
-
 Cambodia
-
 Cameroon
-
 Canada
-
 Chile
-
 China
-
 Colombia
-
 Congo
-
 Costa Rica
-
 Cote d'Ivoire
-
 Croatia
-
 Cuba
-
 Cyprus
-
 Czechia
-
 DR Congo
-
 Denmark
-
 Dominican Republic
-
 Ecuador
-
 Egypt
-
 El Salvador
-
 Estonia
-
 Eswatini
-
 Ethiopia
-
 Finland
-
 France
-
 Georgia
-
 Germany
-
 Ghana
-
 Greece
-
 Haiti
-
 Hong Kong
-
 Hungary
-
 India
-
 Indonesia
-
 Iran, Islamic republic
-
 Iraq
-
 Ireland
-
 Israel
-
 Italy
-
 Jamaica
-
 Japan
-
 Jordan
-
 Kazakhstan
-
 Kenya
-
 Korea
-
 Kuwait
-
 Kyrgyzstan
-
 Laos
-
 Latvia
-
 Lebanon
-
 Lesotho
-
 Libya
-
 Lithuania
-
 Luxembourg
-
 Madagascar
-
 Malaysia
-
 Malta
-
 Mauritius
-
 Mexico
-
 Moldova
-
 Mongolia
-
 Montenegro
-
 Morocco
-
 Mozambique
-
 Myanmar
-
 Namibia
-
 Nepal
-
 Netherlands
-
 New Zealand
-
 Nigeria
-
 North Macedonia
-
 Norway
-
 Oman
-
 Pakistan
-
 Palestine
-
 Panama
-
 Papua New Guinea
-
 Paraguay
-
 Peru
-
 Philippines
-
 Poland
-
 Portugal
-
 Puerto Rico
-
 Qatar
-
 Reunion
-
 Romania
-
 Rwanda
-
 Saudi Arabia
-
 Serbia
-
 Singapore
-
 Slovakia
-
 Slovenia
-
 Somalia
-
 South Africa
-
 Spain
-
 Sri Lanka
-
 Sweden
-
 Switzerland
-
 Syria
-
 Taiwan
-
 Tajikistan
-
 Tanzania
-
 Thailand
-
 Trinidad and Tobago
-
 Tunisia
-
 Turkey
-
 UAE
-
 Uganda
-
 Ukraine
-
 United Kingdom
-
United States
-
 Uruguay
-
 Uzbekistan
-
 Venezuela
-
 Vietnam
-
 Yemen
-
 Zambia
-
 Zimbabwe
- Forex
- Crypto












